Jupyter Snippet CB2nd 08_r
Jupyter Snippet CB2nd 08_r
7.8. Analyzing data with the R programming language in the Jupyter Notebook
import statsmodels.datasets as sd
data = sd.longley.load_pandas()
%load_ext rpy2.ipython
data.endog_name, data.exog_name
('TOTEMP', ['GNPDEFL', 'GNP', 'UNEMP',
            'ARMED', 'POP', 'YEAR'])
y, x = data.endog, data.exog
x['TOTEMP'] = y
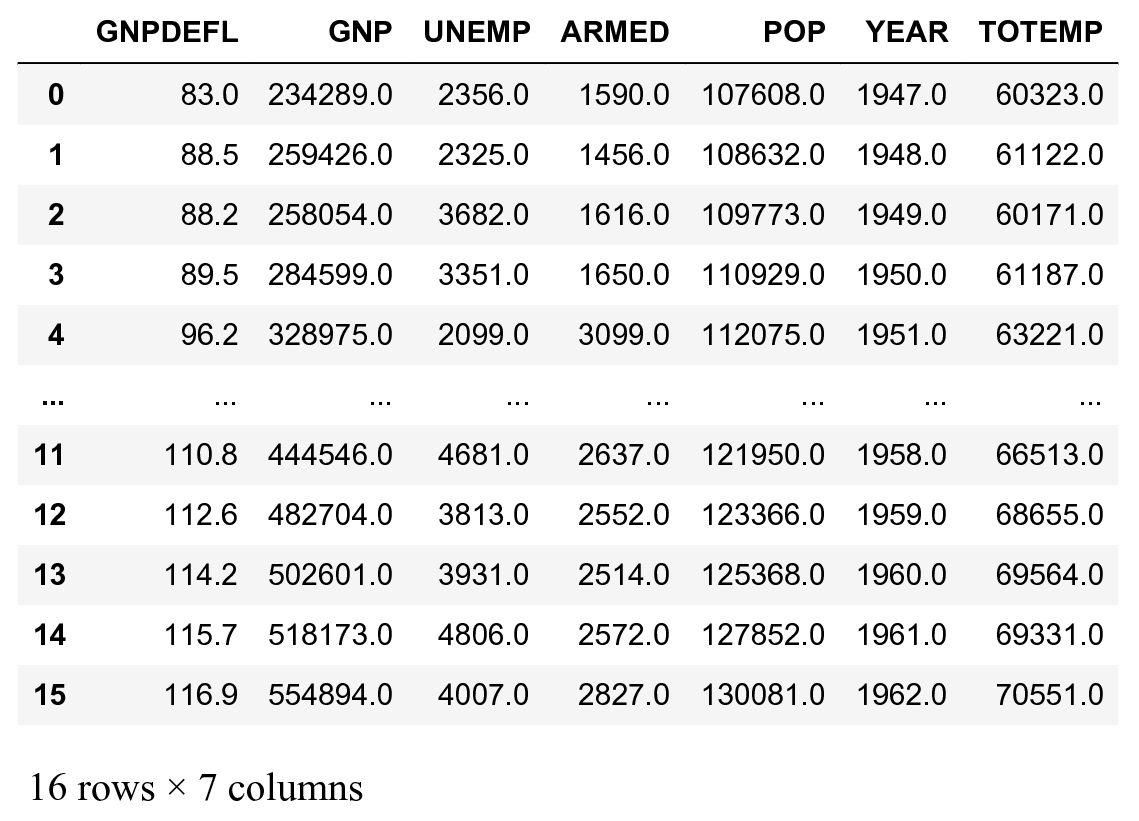
x

gnp = x['GNP']
totemp = x['TOTEMP']
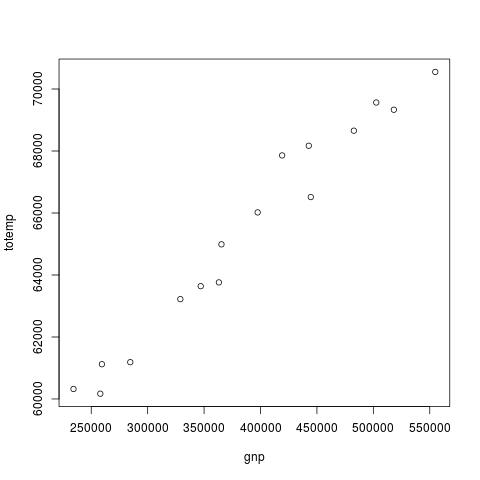
%R -i totemp,gnp plot(gnp, totemp)

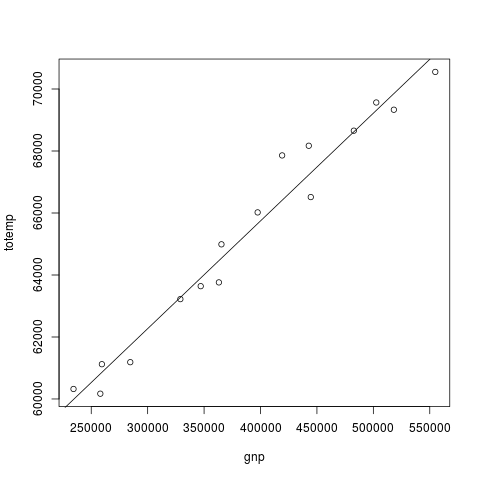
%%R
# Least-squares regression
fit <- lm(totemp ~ gnp)
# Display the coefficients of the fit.
print(fit$coefficients)
# Plot the data points.
plot(gnp, totemp)
# And plot the linear regression.
abline(fit)
