Jupyter Snippet CB2nd 06_gis
Jupyter Snippet CB2nd 06_gis
14.6. Manipulating geospatial data with Cartopy
import io
import requests
import zipfile
import numpy as np
import matplotlib.pyplot as plt
import matplotlib.collections as col
from matplotlib.colors import Normalize
import cartopy.crs as ccrs
from cartopy.feature import ShapelyFeature
import cartopy.io.shapereader as shpreader
%matplotlib inline
url = ('https://github.com/ipython-books/'
       'cookbook-2nd-data/blob/master/'
       'africa.zip?raw=true')
r = io.BytesIO(requests.get(url).content)
zipfile.ZipFile(r).extractall('data')
countries = shpreader.Reader(
    'data/ne_10m_admin_0_countries.shp')
africa = [c for c in countries.records()
          if c.attributes['CONTINENT'] == 'Africa']
crs = ccrs.PlateCarree()
extent = [-23.03, 55.20, -37.72, 40.58]
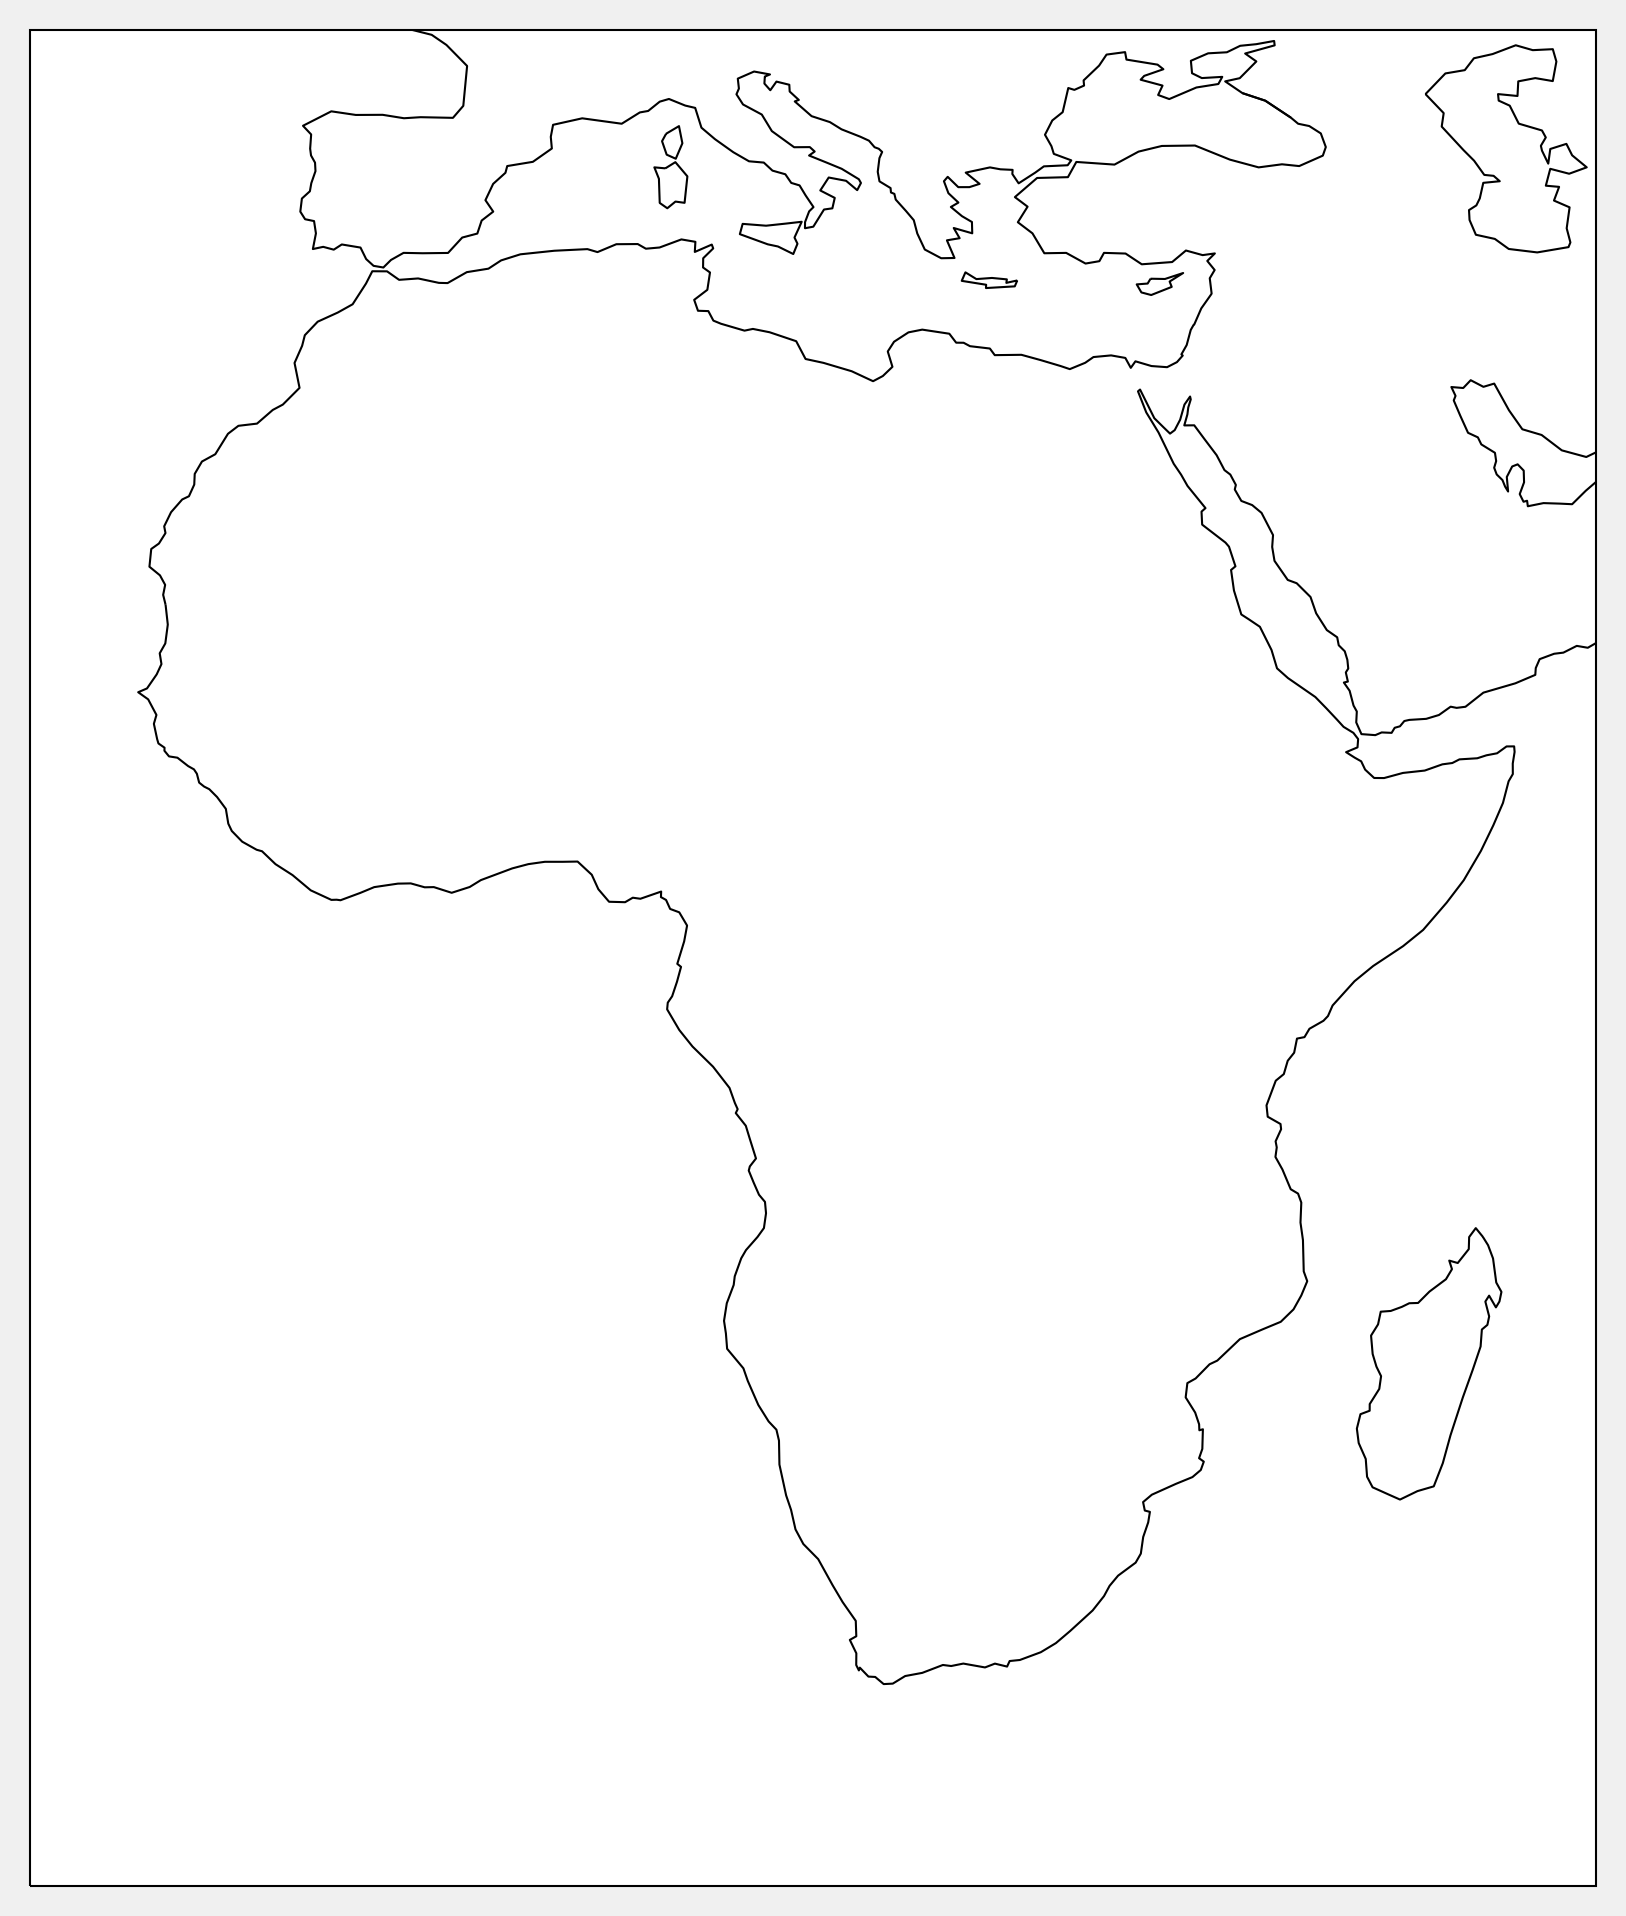
def draw_africa(ax):
    ax.set_extent(extent)
    ax.coastlines()
fig, ax = plt.subplots(
    1, 1, figsize=(6, 8),
    subplot_kw=dict(projection=crs))
draw_africa(ax)

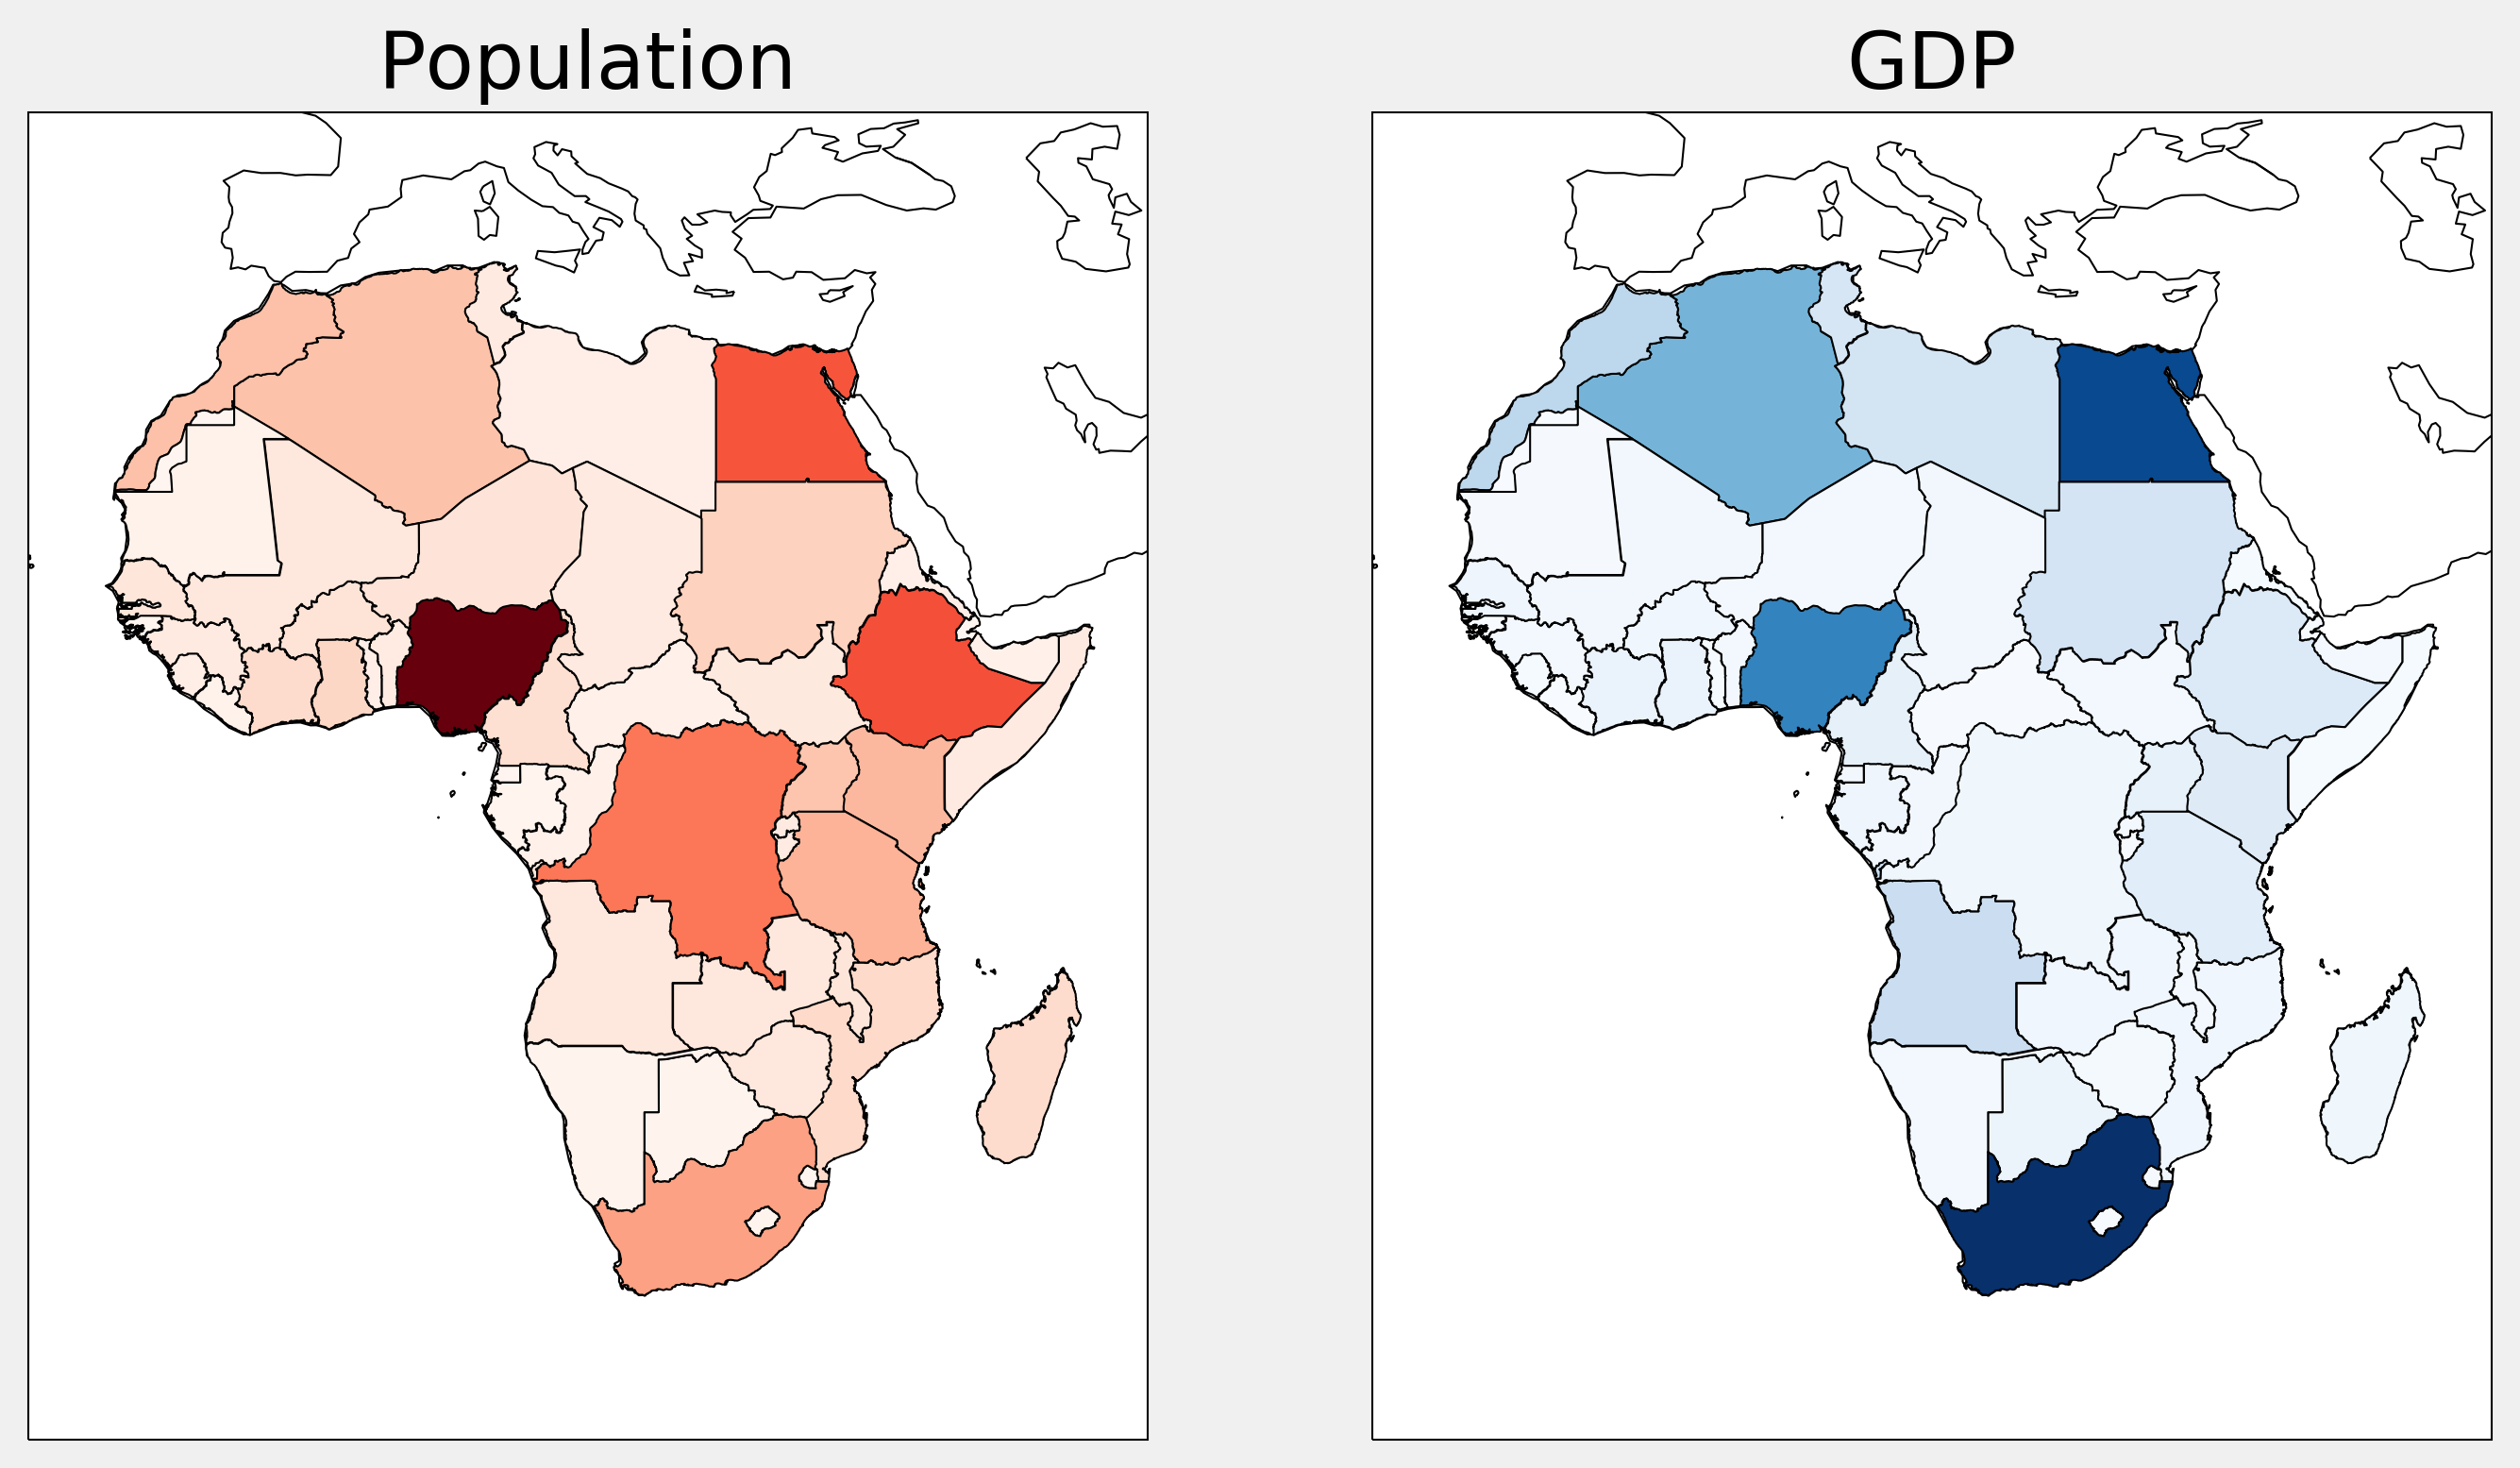
def choropleth(ax, attr, cmap_name):
    # We need to normalize the values before we can
    # use the colormap.
    values = [c.attributes[attr] for c in africa]
    norm = Normalize(
        vmin=min(values), vmax=max(values))
    cmap = plt.cm.get_cmap(cmap_name)
    for c in africa:
        v = c.attributes[attr]
        sp = ShapelyFeature(c.geometry, crs,
                            edgecolor='k',
                            facecolor=cmap(norm(v)))
        ax.add_feature(sp)
fig, (ax1, ax2) = plt.subplots(
    1, 2, figsize=(10, 16),
    subplot_kw=dict(projection=crs))
draw_africa(ax1)
choropleth(ax1, 'POP_EST', 'Reds')
ax1.set_title('Population')

draw_africa(ax2)
choropleth(ax2, 'GDP_MD_EST', 'Blues')
ax2.set_title('GDP')
