Jupyter Snippet CB2nd 05_widgets
Jupyter Snippet CB2nd 05_widgets
6.5. Discovering interactive visualization libraries in the Notebook
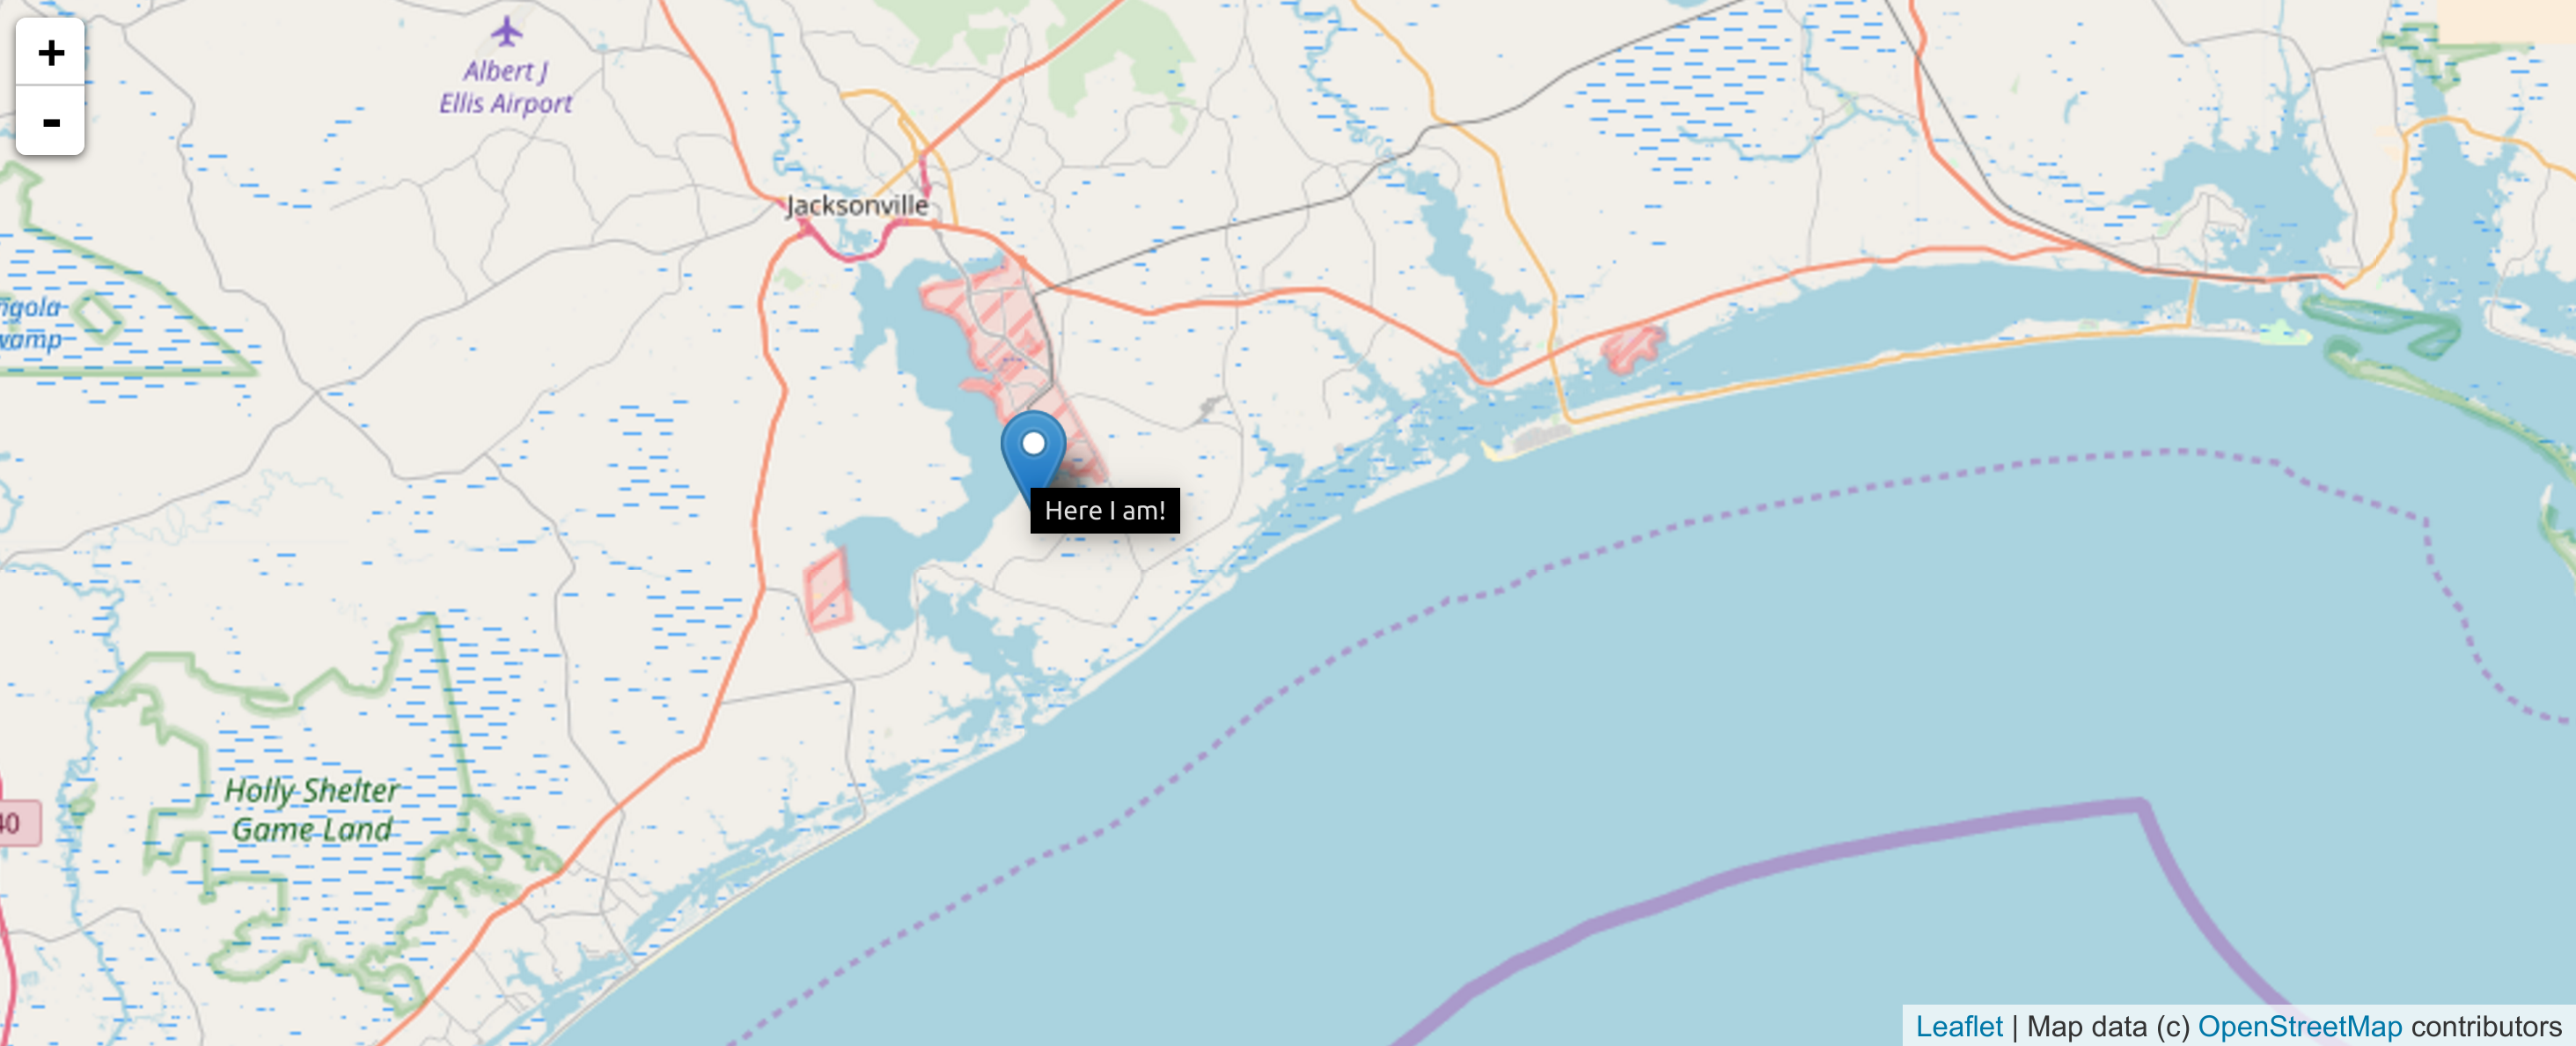
from ipyleaflet import Map, Marker
pos = [34.62, -77.34]
m = Map(center=pos, zoom=10)
marker = Marker(location=pos,
                rise_on_hover=True,
                title="Here I am!",
                )
m += marker
m

import numpy as np
import bqplot.pyplot as plt
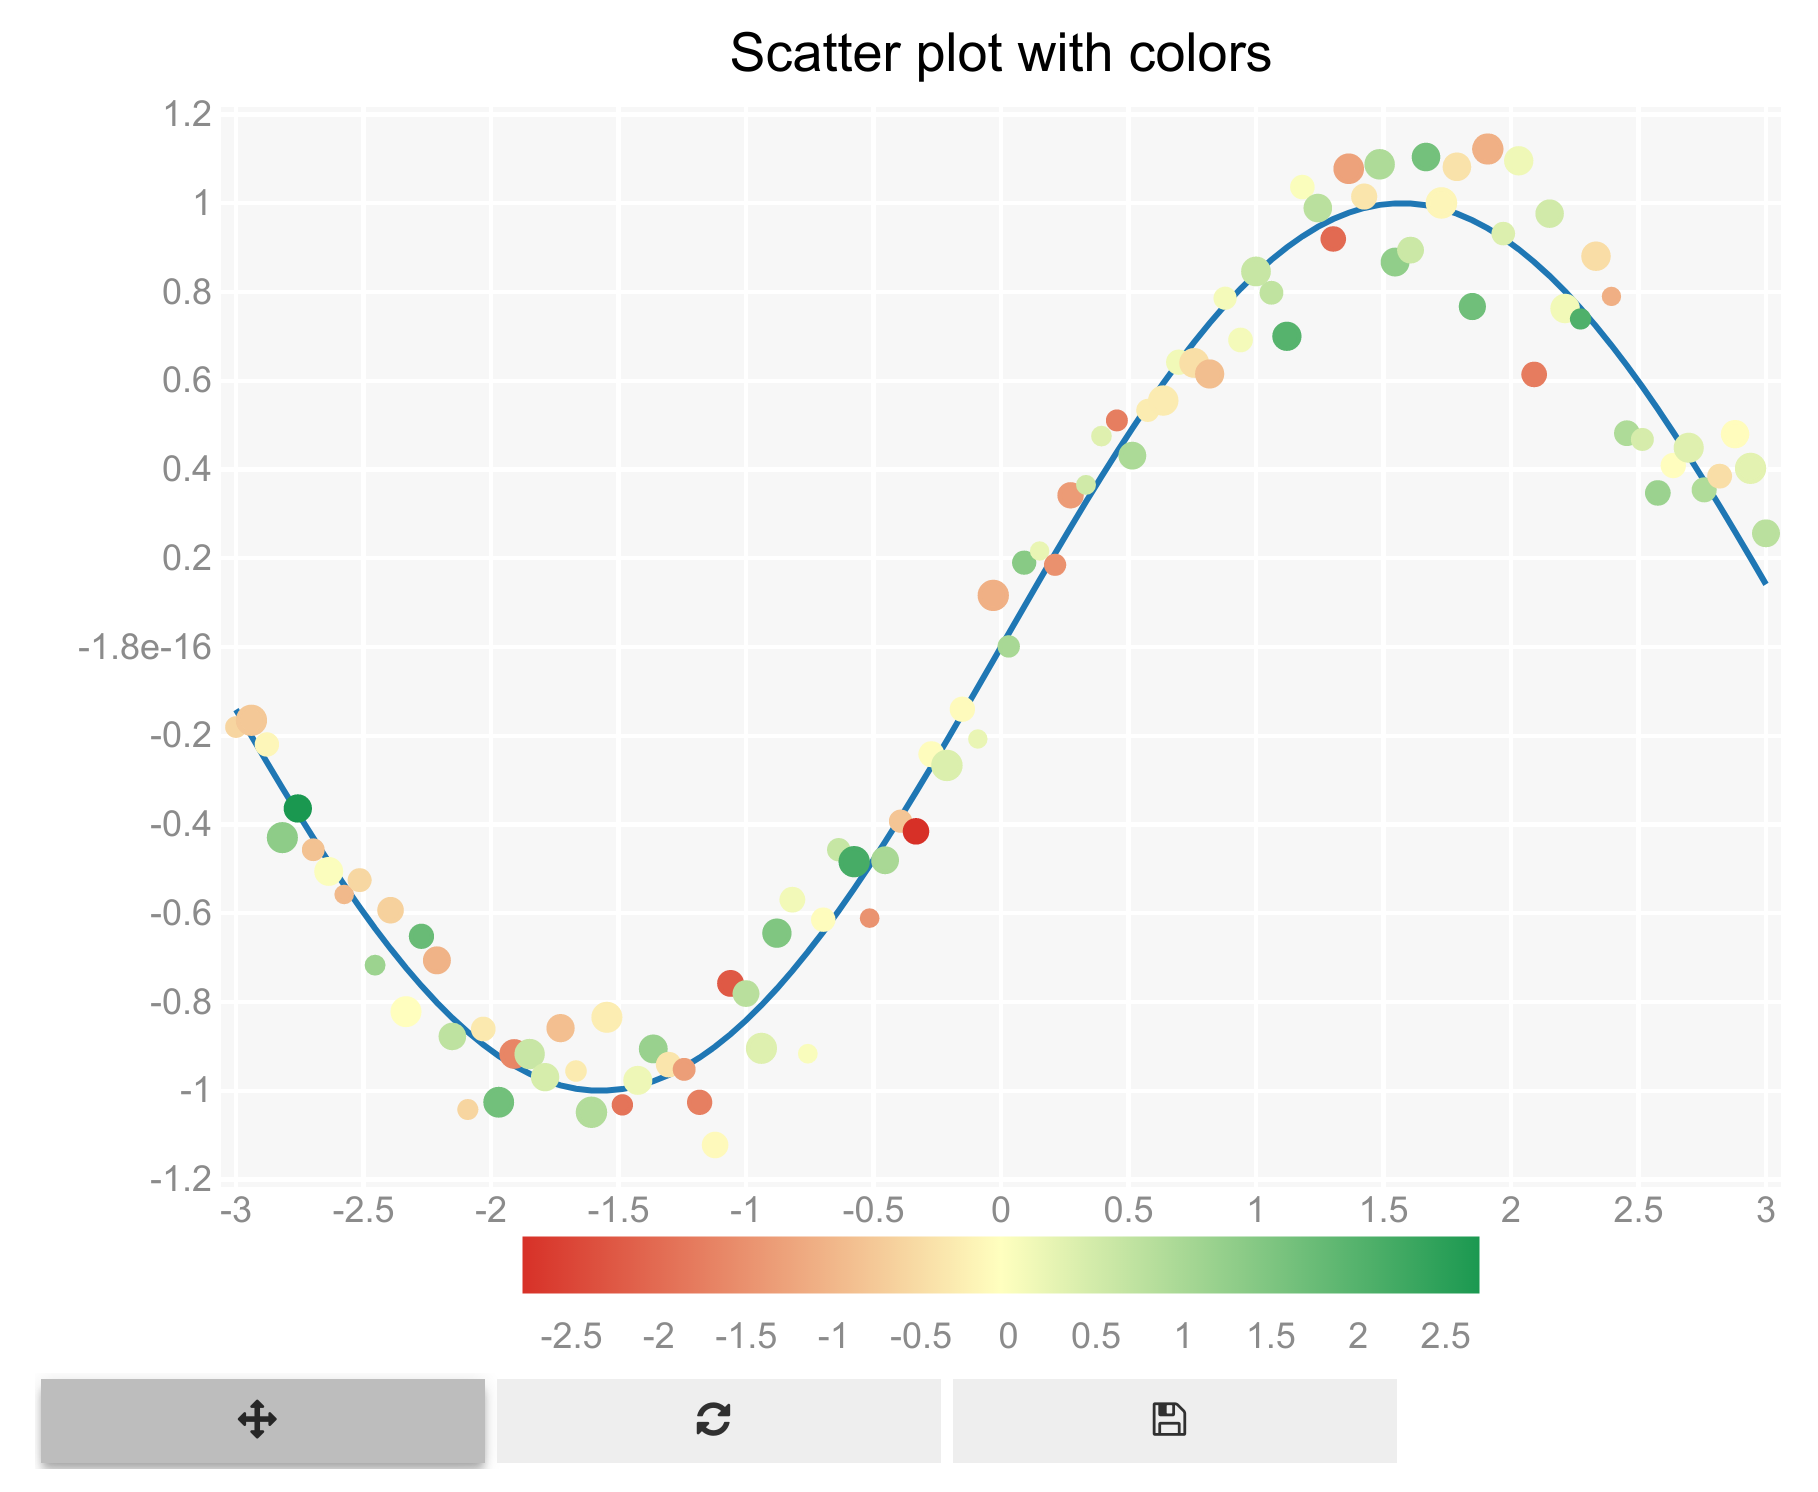
plt.figure(title='Scatter plot with colors')
t = np.linspace(-3, 3, 100)
x = np.sin(t)
y = np.sin(t) + .1 * np.random.randn(100)
plt.plot(t, x)
plt.scatter(t, y,
            size=np.random.uniform(15, 50, 100),
            color=np.random.randn(100))
plt.show()

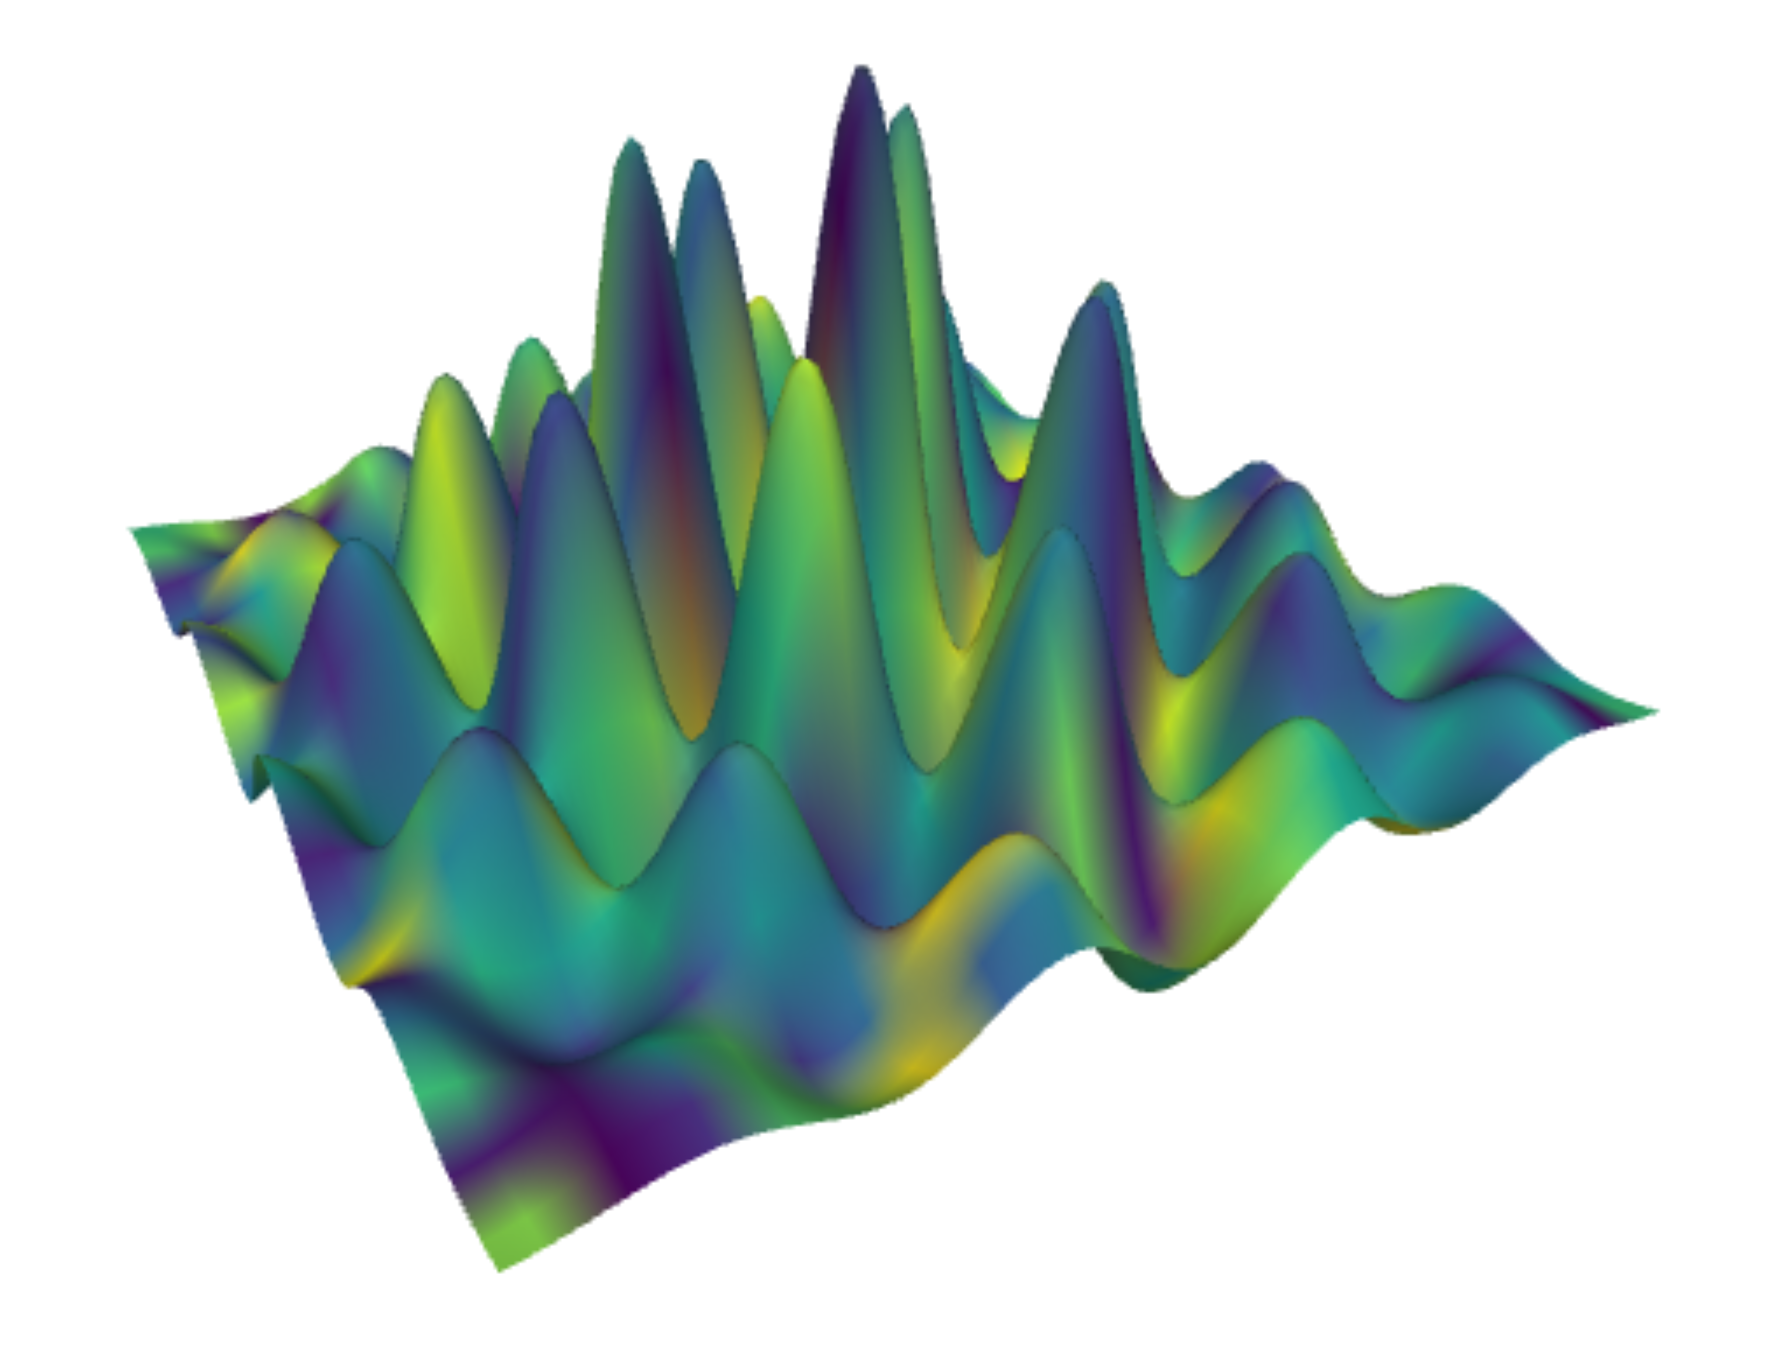
from pythreejs import *
f = """
function f(x, y) {
    x = 2 * (x - .5);
    y = 2 * (y - .5);
    r2 = x * x + y * y;
    var z = Math.exp(-2 * r2) * (
        Math.cos(12*x) * Math.sin(12*y));
    return new THREE.Vector3(x, y, z)
}
"""
texture = np.random.uniform(.5, .9, (20, 20))
material = LambertMaterial(
    map=height_texture(texture))
alight = AmbientLight(color='#777777')
dlight = DirectionalLight(color='white',
                          position=[3, 5, 1],
                          intensity=0.6)
surf_g = ParametricGeometry(func=f)
surf = Mesh(geometry=surf_g,
            material=material)
scene = Scene(children=[surf, alight])
c = PerspectiveCamera(position=[2.5, 2.5, 2.5],
                      up=[0, 0, 1],
                      children=[dlight])
Renderer(camera=c, scene=scene,
         controls=[OrbitControls(controlling=c)])

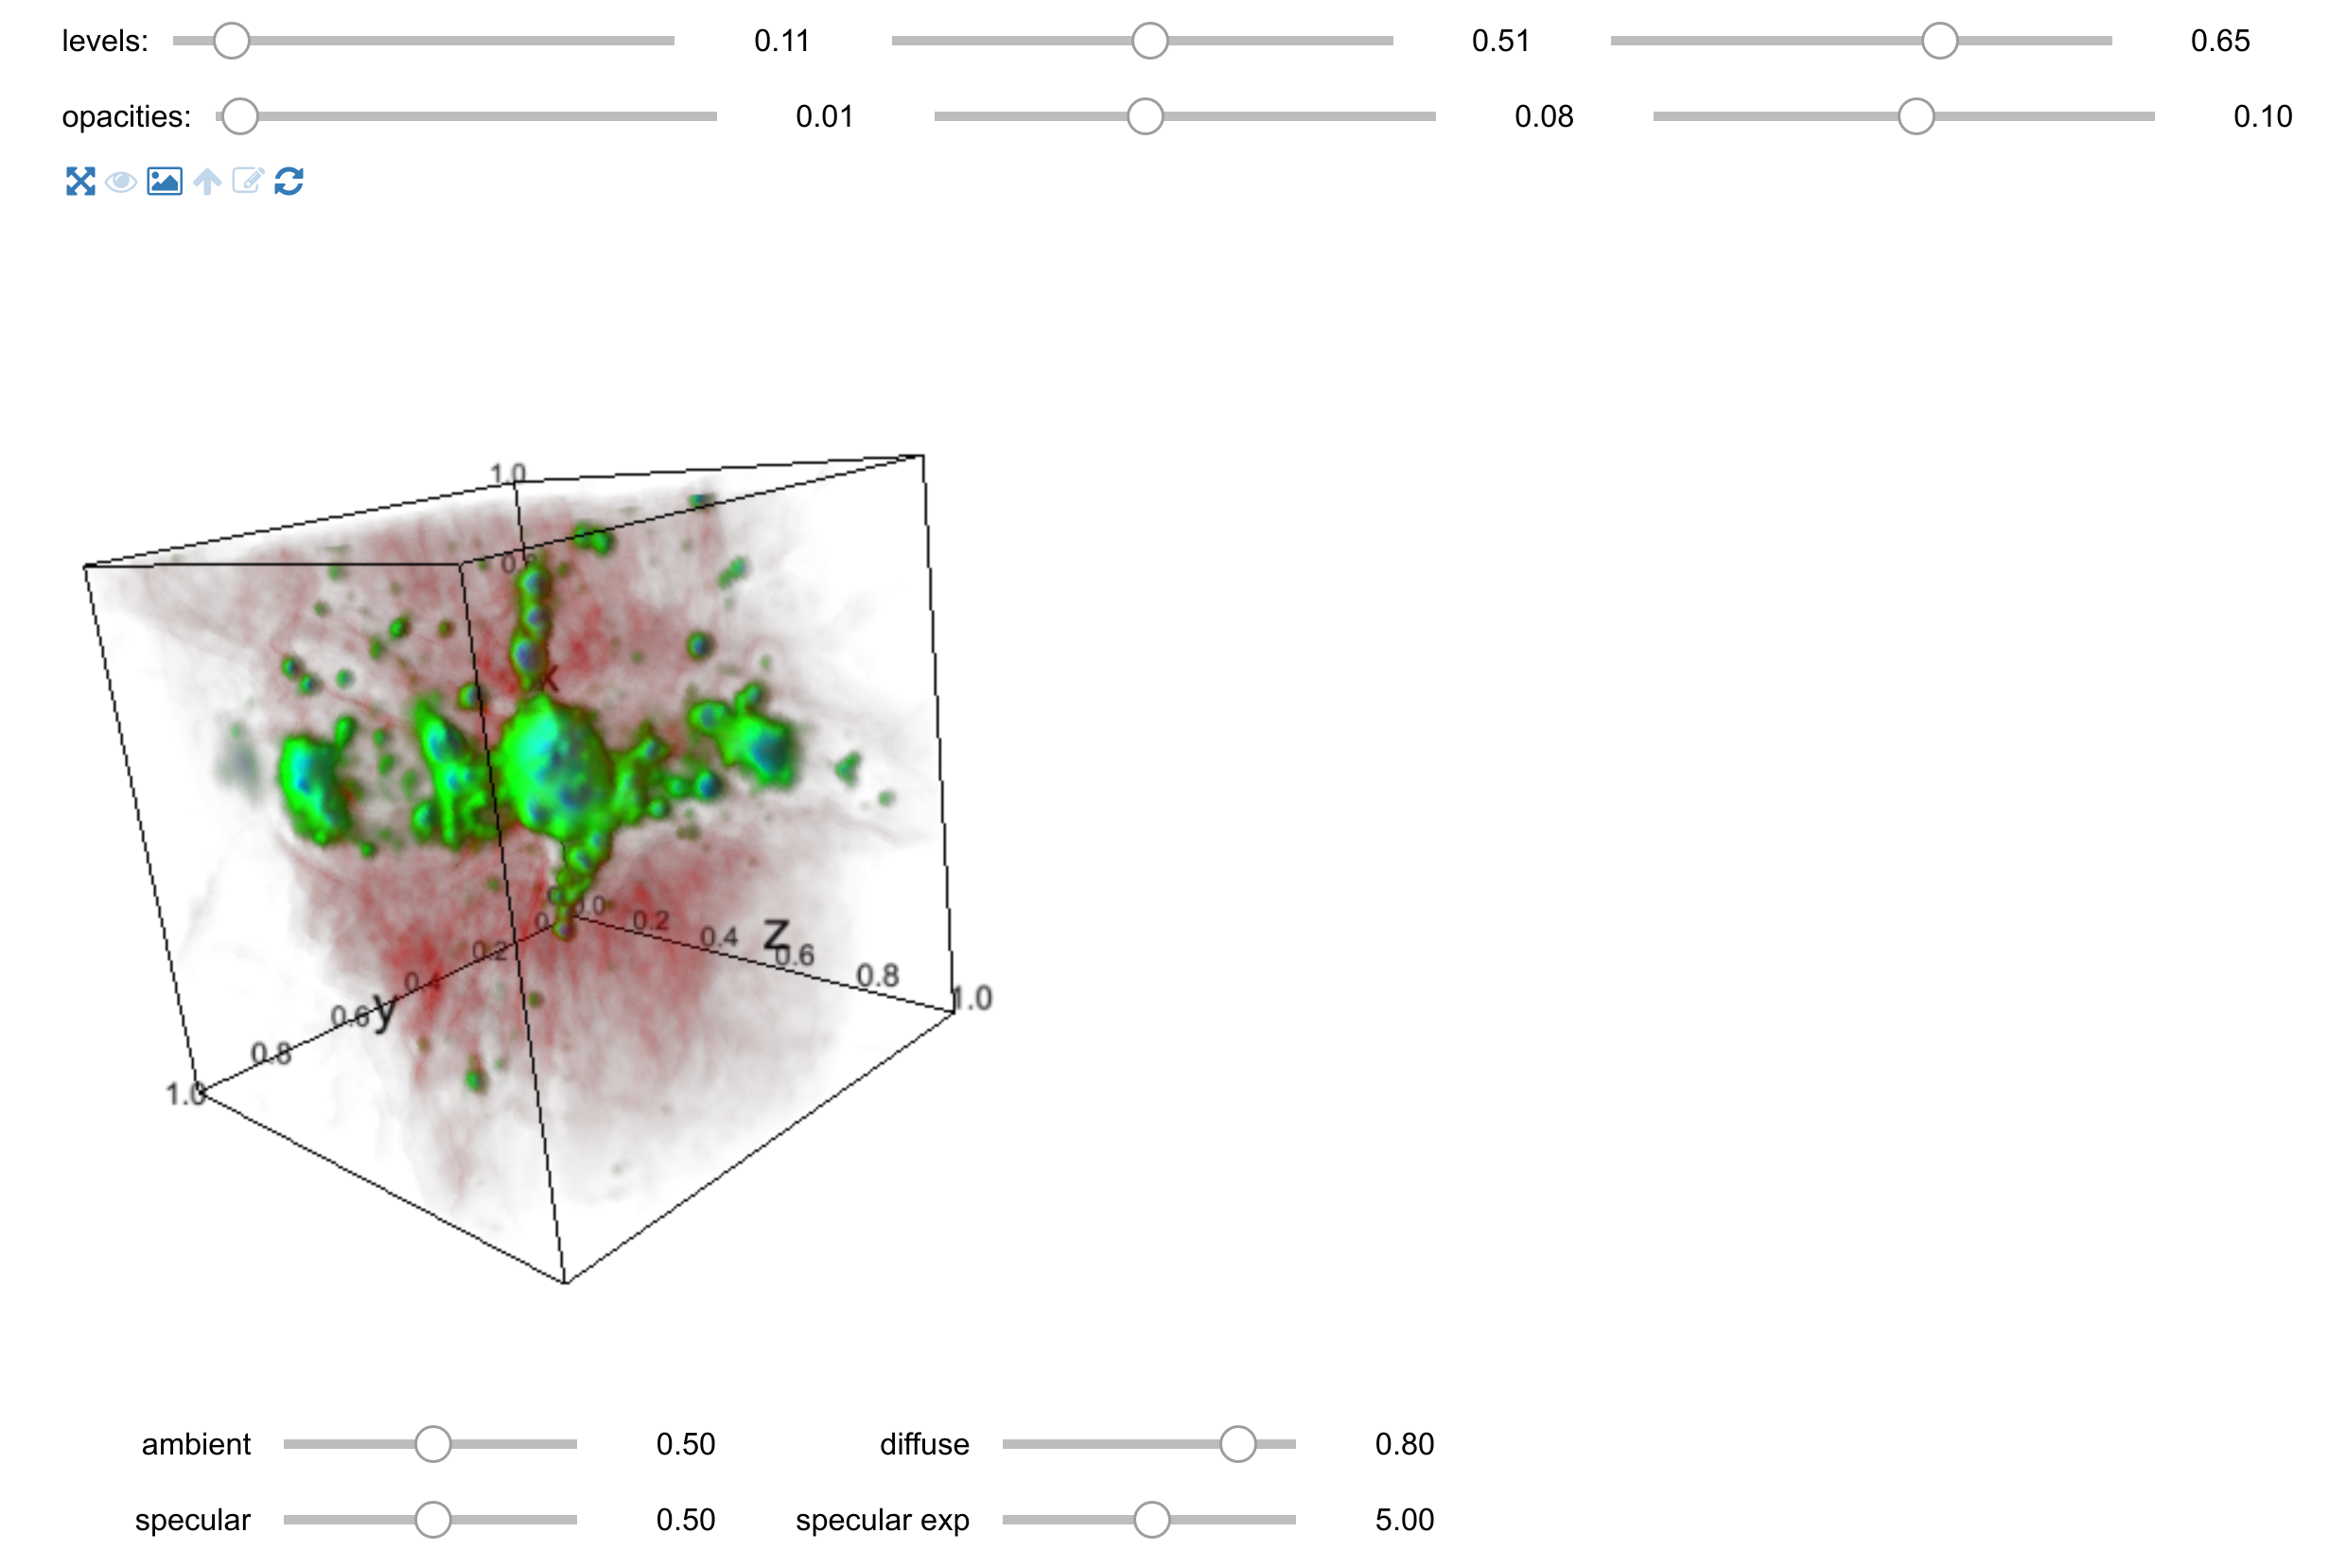
import ipyvolume
ds = ipyvolume.datasets.aquariusA2.fetch()
ipyvolume.quickvolshow(ds.data, lighting=True)
