Jupyter Snippet CB2nd 03_curvefitting
Jupyter Snippet CB2nd 03_curvefitting
9.3. Fitting a function to data with nonlinear least squares
import numpy as np
import scipy.optimize as opt
import matplotlib.pyplot as plt
%matplotlib inline
def f(x, a, b, c, d):
    return a / (1. + np.exp(-c * (x - d))) + b
a, c = np.random.exponential(size=2)
b, d = np.random.randn(2)
n = 100
x = np.linspace(-10., 10., n)
y_model = f(x, a, b, c, d)
y = y_model + a * .2 * np.random.randn(n)
fig, ax = plt.subplots(1, 1, figsize=(6, 4))
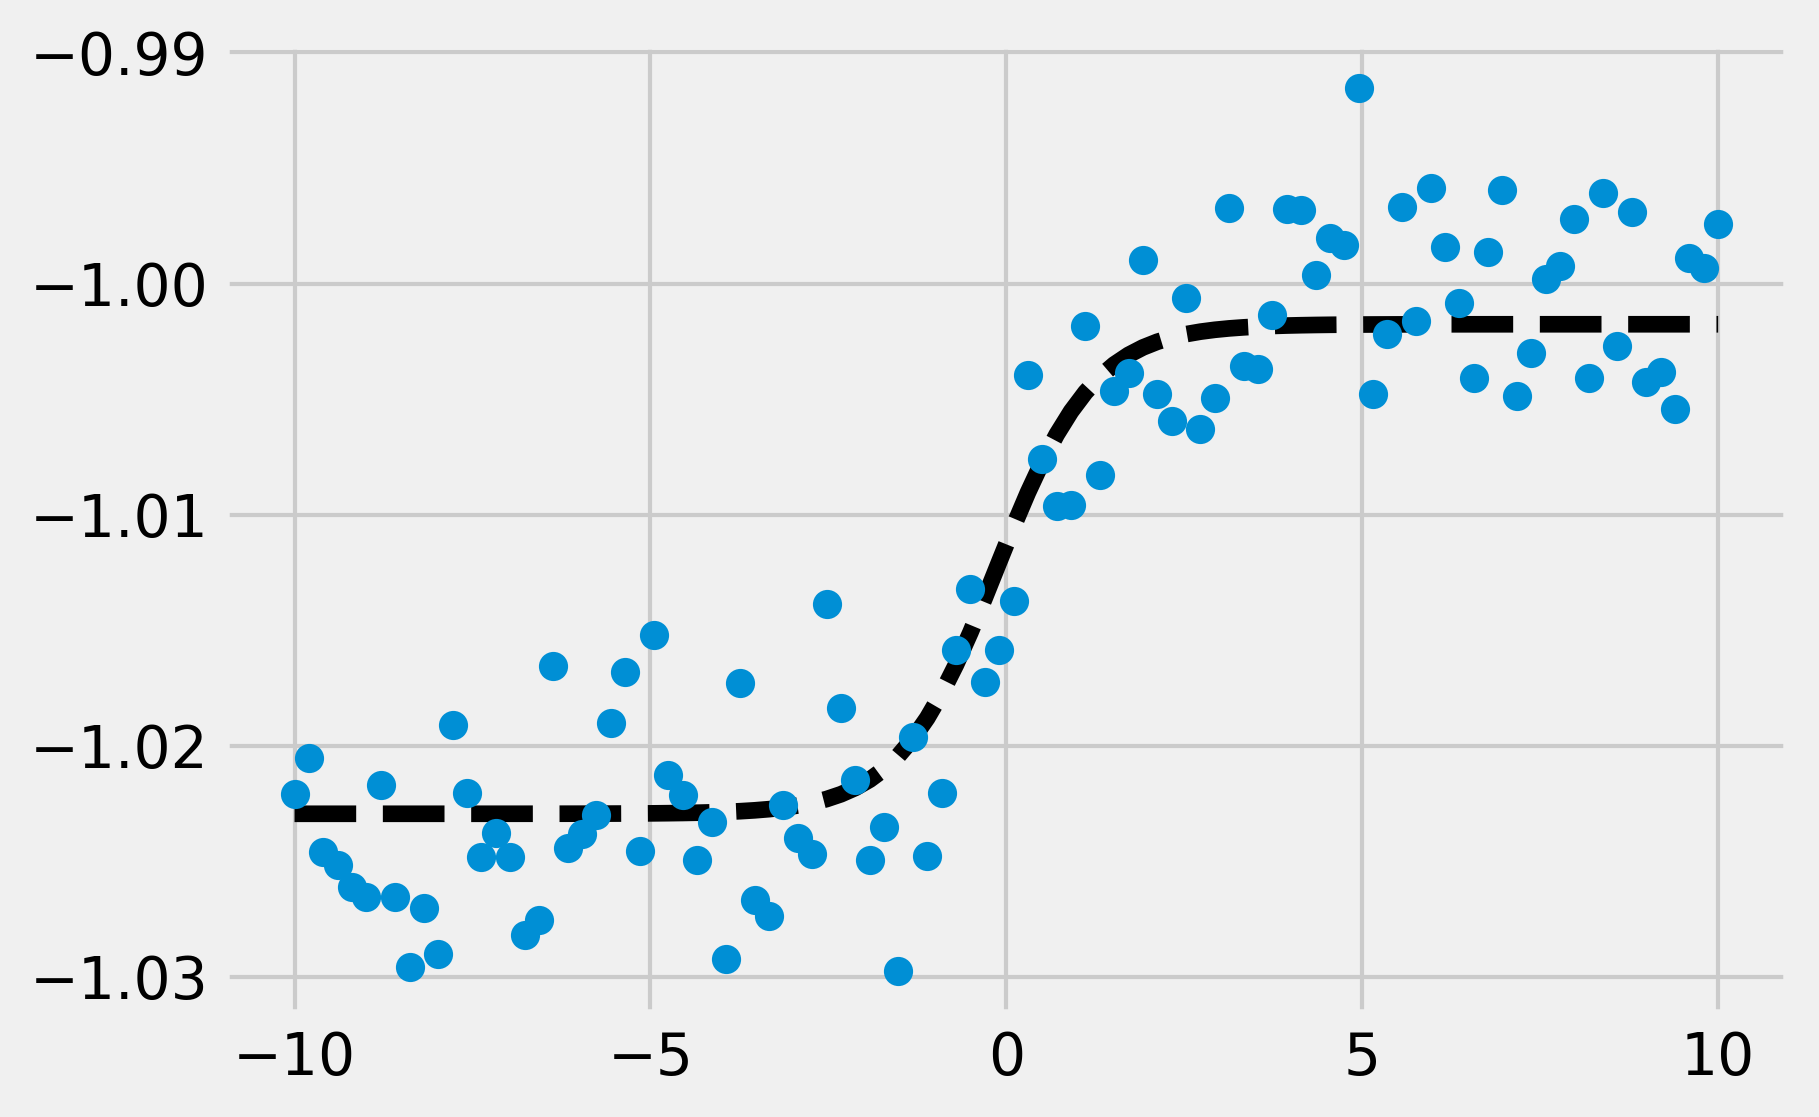
ax.plot(x, y_model, '--k')
ax.plot(x, y, 'o')

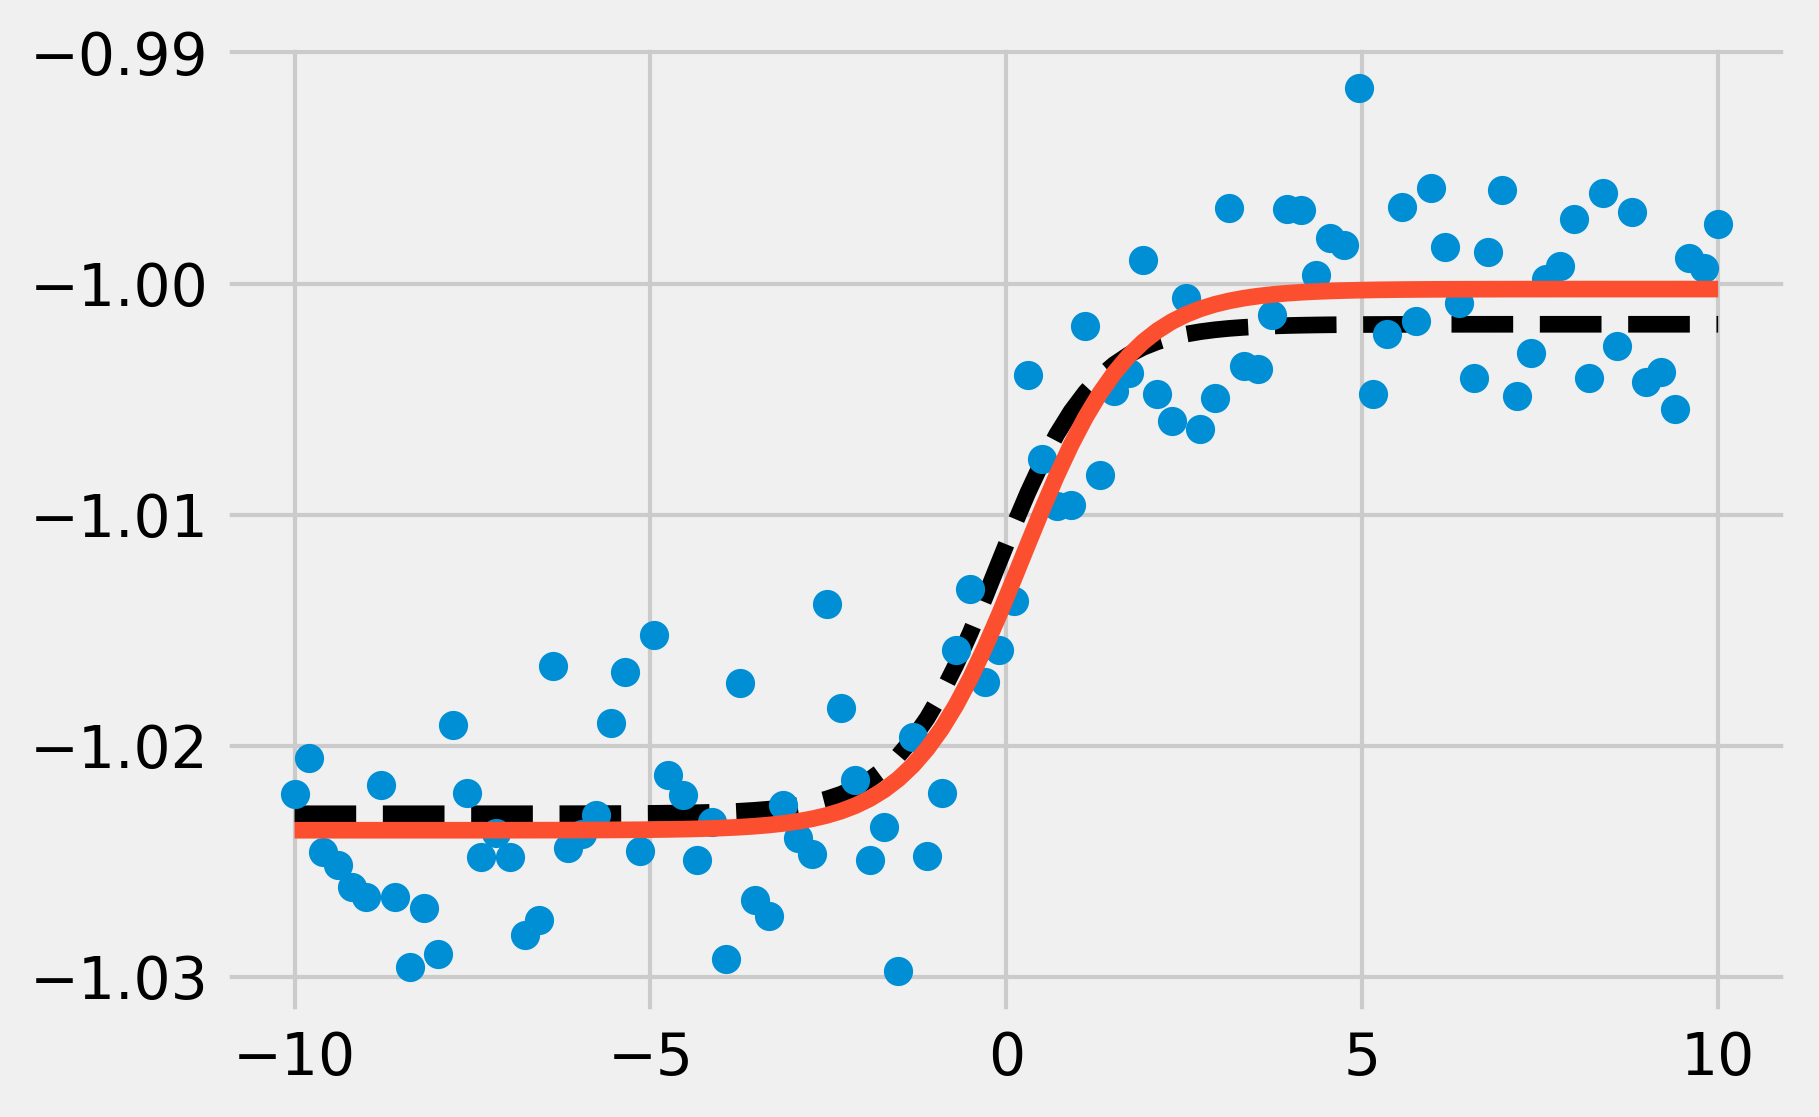
(a_, b_, c_, d_), _ = opt.curve_fit(f, x, y)
y_fit = f(x, a_, b_, c_, d_)
fig, ax = plt.subplots(1, 1, figsize=(6, 4))
ax.plot(x, y_model, '--k')
ax.plot(x, y, 'o')
ax.plot(x, y_fit, '-')
