Jupyter Snippet CB2nd 02_seaborn
Jupyter Snippet CB2nd 02_seaborn
6.2. Creating statistical plots easily with seaborn
import numpy as np
from scipy import stats
import matplotlib.pyplot as plt
import seaborn as sns
%matplotlib inline
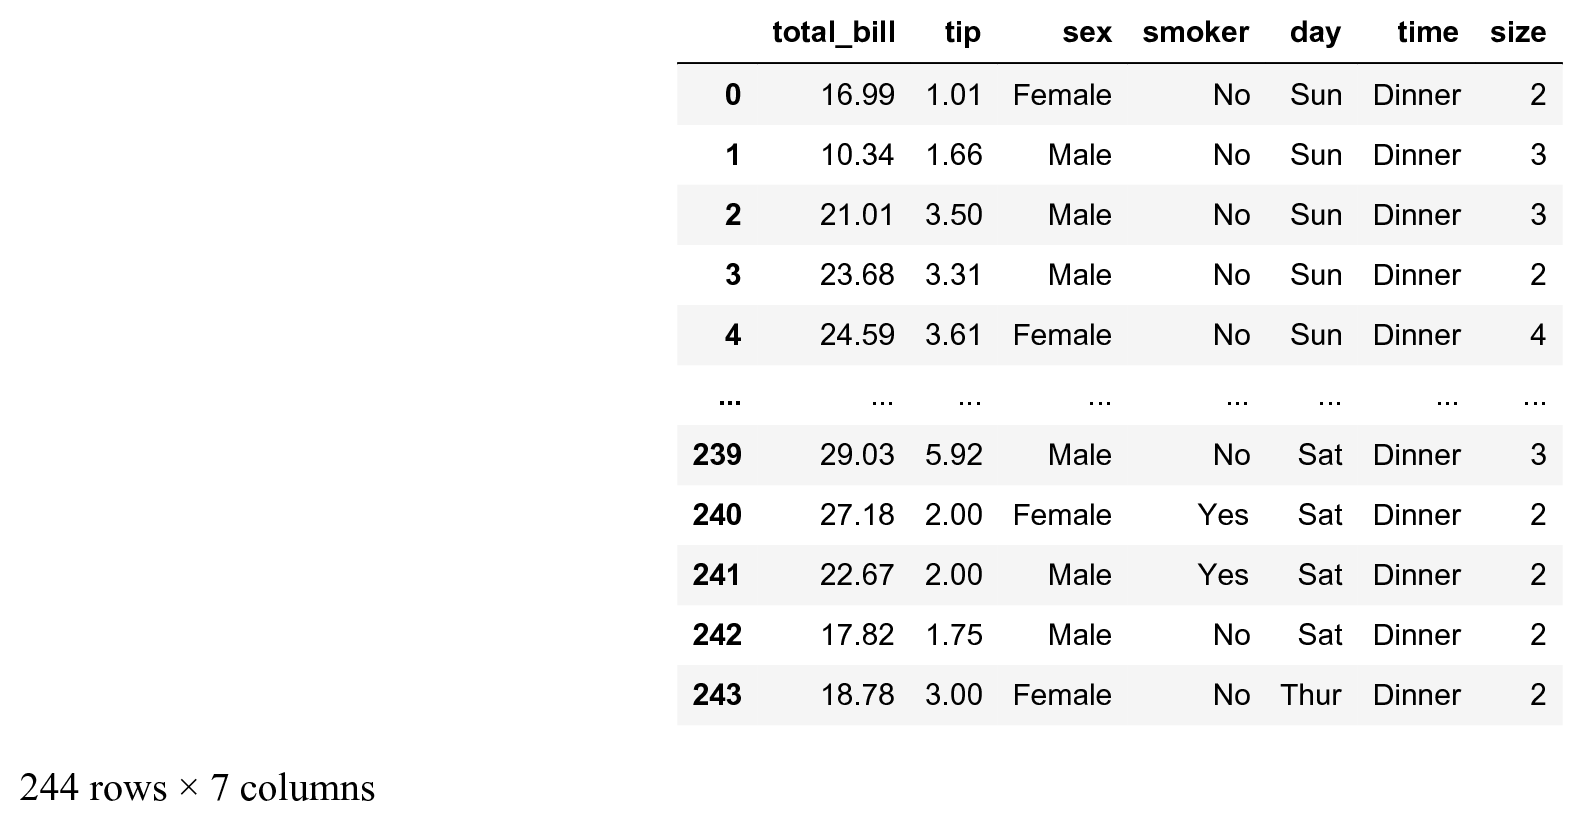
tips = sns.load_dataset('tips')
tips

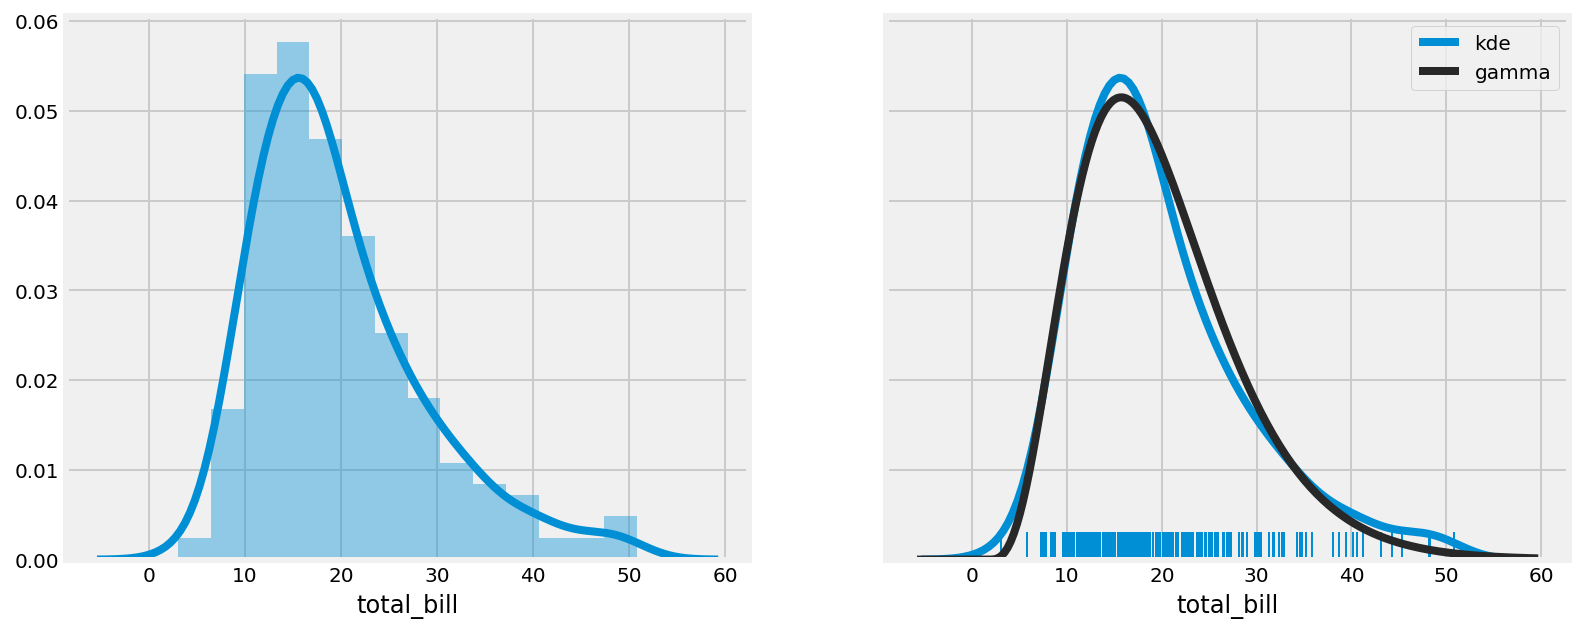
# We create two subplots sharing the same y axis.
f, (ax1, ax2) = plt.subplots(1, 2,
                       figsize=(12, 5),
                       sharey=True)

# Left subplot.
# Histogram and KDE (active by default).
sns.distplot(tips.total_bill,
             ax=ax1,
             hist=True)

# Right subplot.
# "Rugplot", KDE, and gamma fit.
sns.distplot(tips.total_bill,
             ax=ax2,
             hist=False,
             kde=True,
             rug=True,
             fit=stats.gamma,
             fit_kws=dict(label='gamma'),
             kde_kws=dict(label='kde'))
ax2.legend()

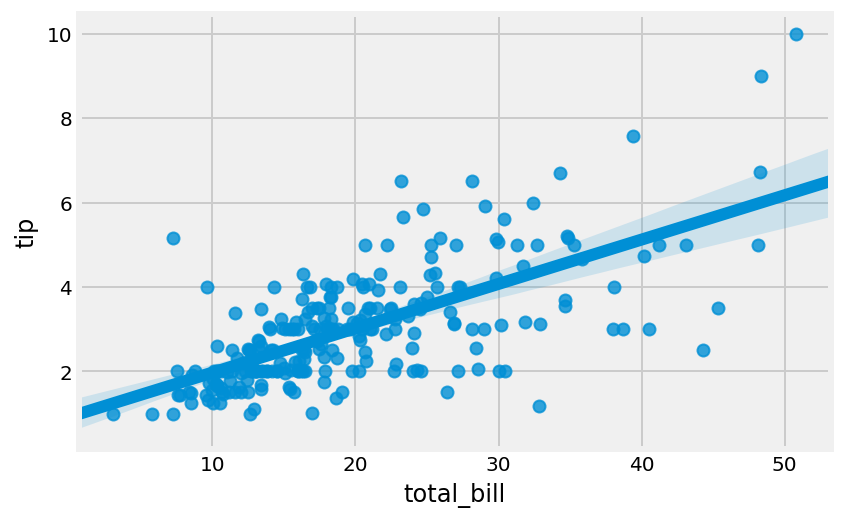
sns.regplot(x="total_bill", y="tip", data=tips)

f, (ax1, ax2, ax3) = plt.subplots(
    1, 3, figsize=(12, 4), sharey=True)
sns.barplot(x='sex', y='tip', data=tips, ax=ax1)
sns.violinplot(x='sex', y='tip', data=tips, ax=ax2)
sns.swarmplot(x='sex', y='tip', data=tips, ax=ax3)

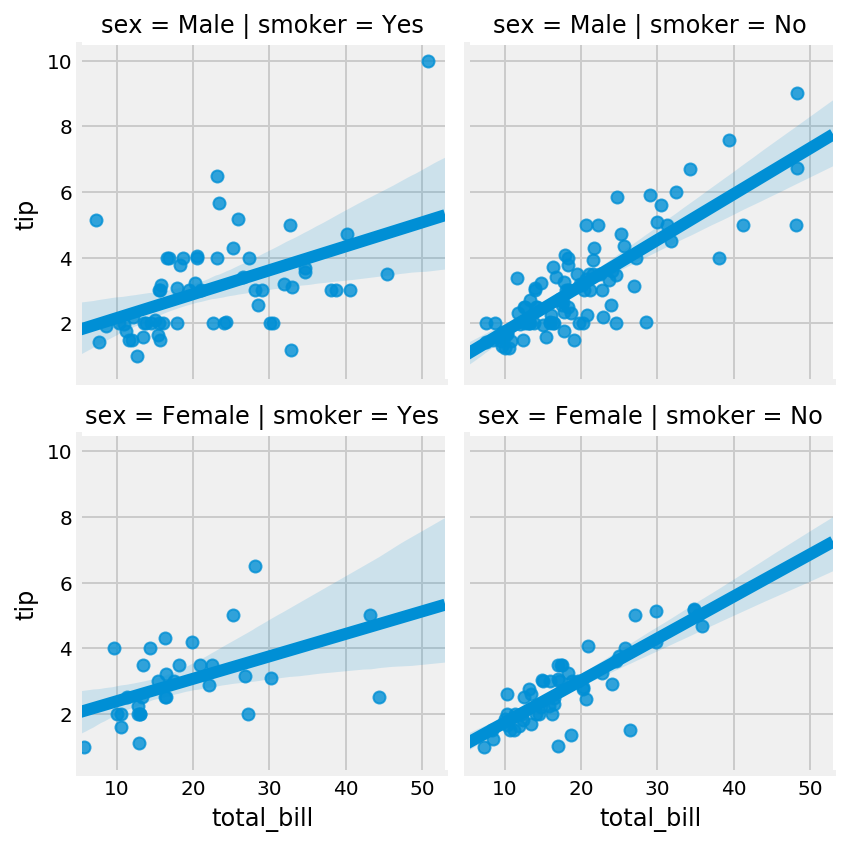
g = sns.FacetGrid(tips, col='smoker', row='sex')
g.map(sns.regplot, 'total_bill', 'tip')
