Jupyter Snippet CB2nd 02_poisson
Jupyter Snippet CB2nd 02_poisson
13.2. Simulating a Poisson process
import numpy as np
import matplotlib.pyplot as plt
%matplotlib inline
rate = 20. # average number of events per second
dt = .001  # time step
n = int(1. / dt)  # number of time steps
x = np.zeros(n)
x[np.random.rand(n) <= rate * dt] = 1
x[:10]
array([ 1., 0., ..., 0., 0.])
fig, ax = plt.subplots(1, 1, figsize=(6, 2))
ax.vlines(np.nonzero(x)[0], 0, 1)
ax.set_axis_off()

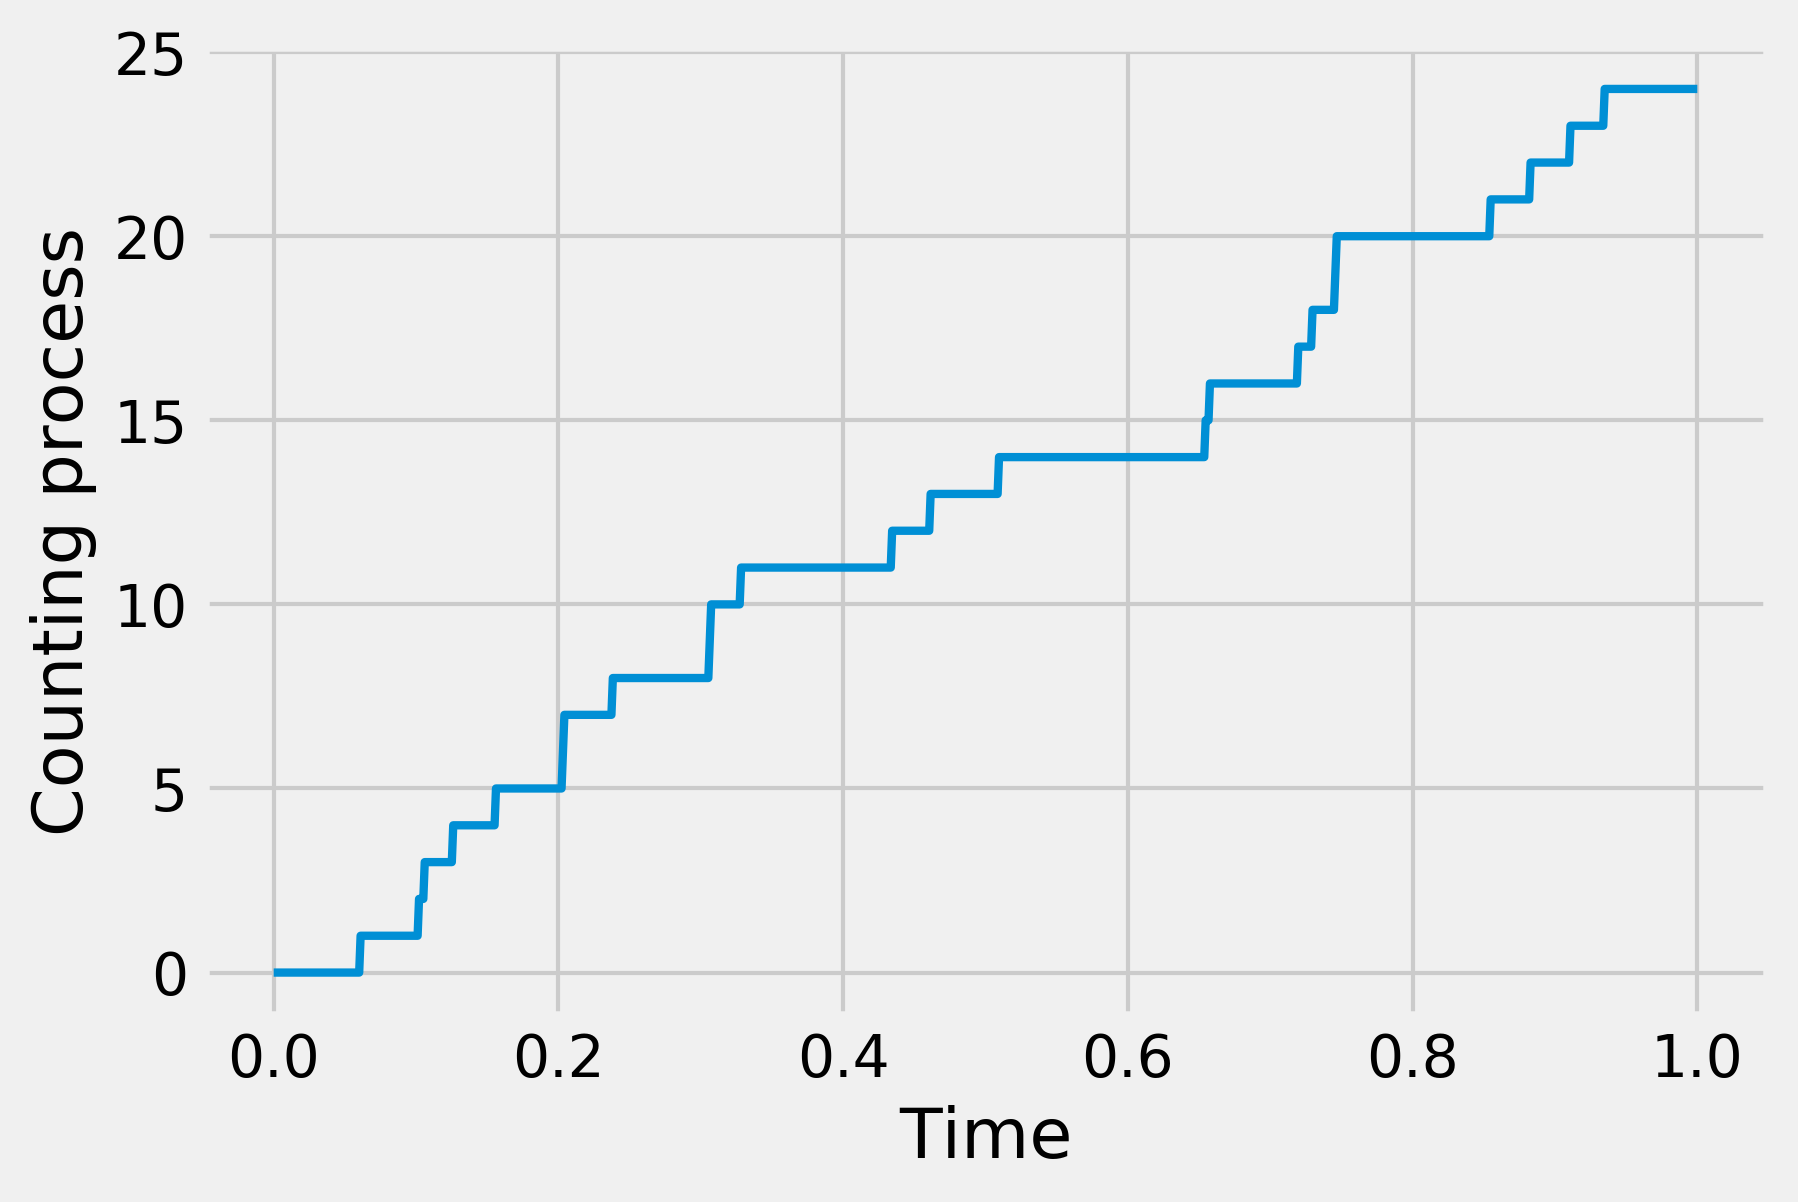
fig, ax = plt.subplots(1, 1, figsize=(6, 4))
ax.plot(np.linspace(0., 1., n),
        np.cumsum(x), lw=2)
ax.set_xlabel("Time")
ax.set_ylabel("Counting process")

y = np.cumsum(np.random.exponential(1. / rate,
                                    size=int(rate)))
y[:10]
array([ 0.021,  0.072,  0.087,  0.189,  0.224,
        0.365,  0.382,  0.392,  0.458,  0.489])
fig, ax = plt.subplots(1, 1, figsize=(8, 3))
ax.vlines(y, 0, 1)
ax.set_axis_off()
