Jupyter Snippet CB2nd 01_scikit
Jupyter Snippet CB2nd 01_scikit
8.1. Getting started with scikit-learn
import numpy as np
import scipy.stats as st
import sklearn.linear_model as lm
import matplotlib.pyplot as plt
%matplotlib inline
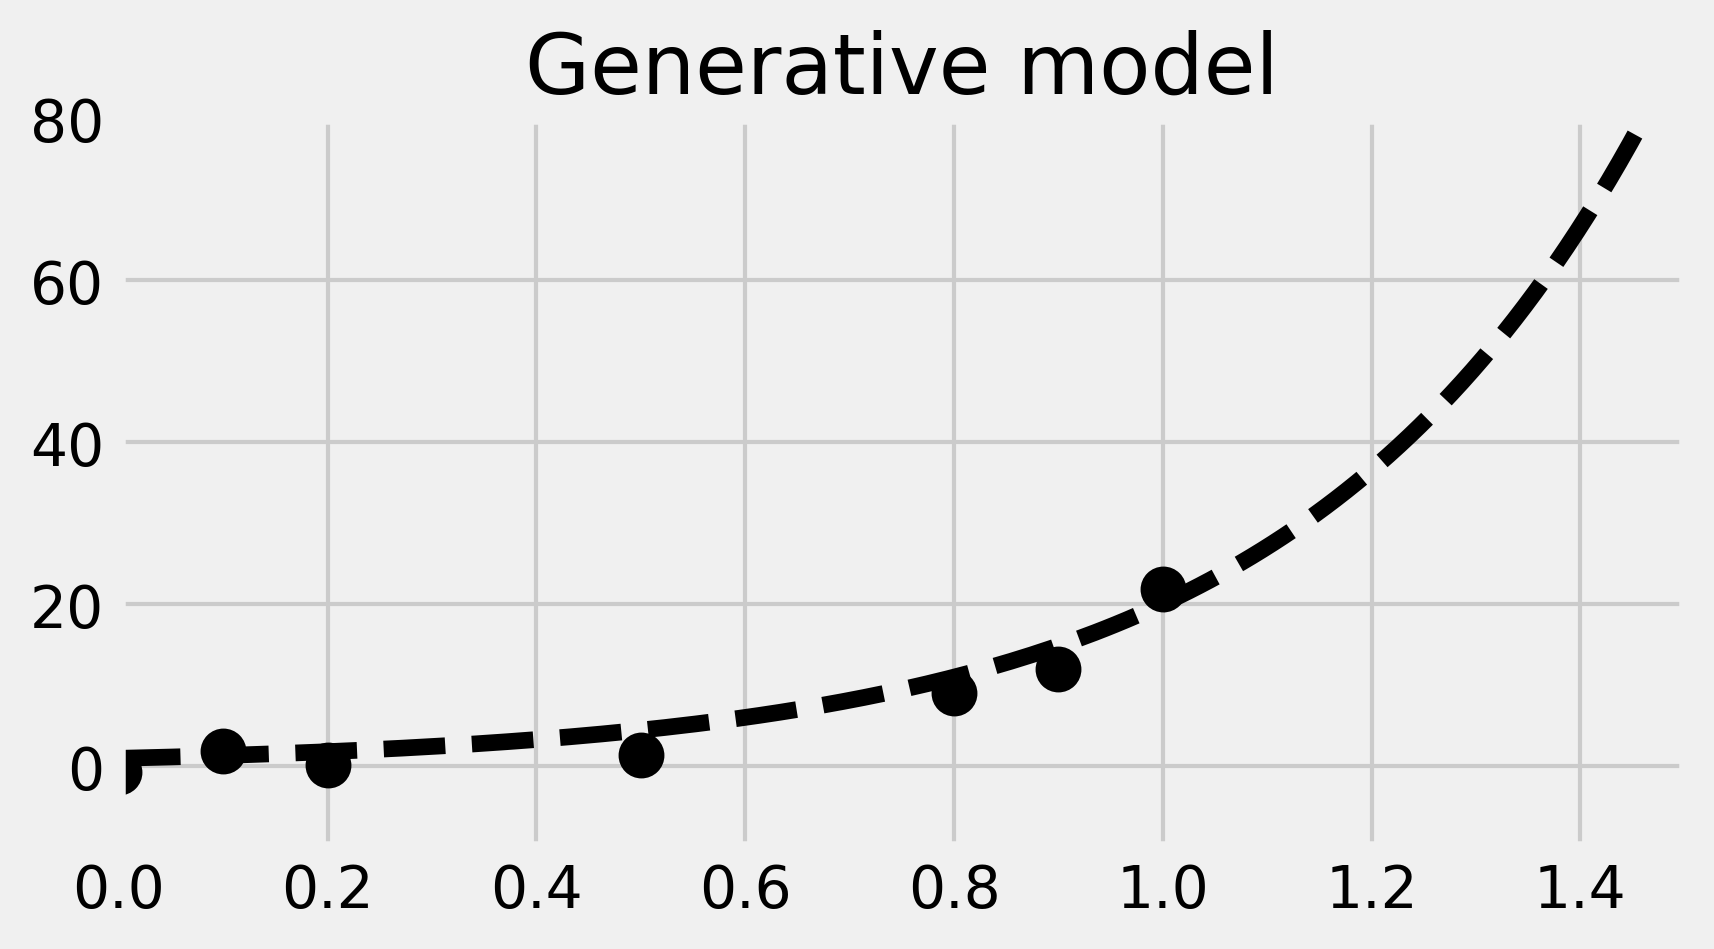
def f(x):
    return np.exp(3 * x)
x_tr = np.linspace(0., 2, 200)
y_tr = f(x_tr)
x = np.array([0, .1, .2, .5, .8, .9, 1])
y = f(x) + 2 * np.random.randn(len(x))
fig, ax = plt.subplots(1, 1, figsize=(6, 3))
ax.plot(x_tr, y_tr, '--k')
ax.plot(x, y, 'ok', ms=10)
ax.set_xlim(0, 1.5)
ax.set_ylim(-10, 80)
ax.set_title('Generative model')

# We create the model.
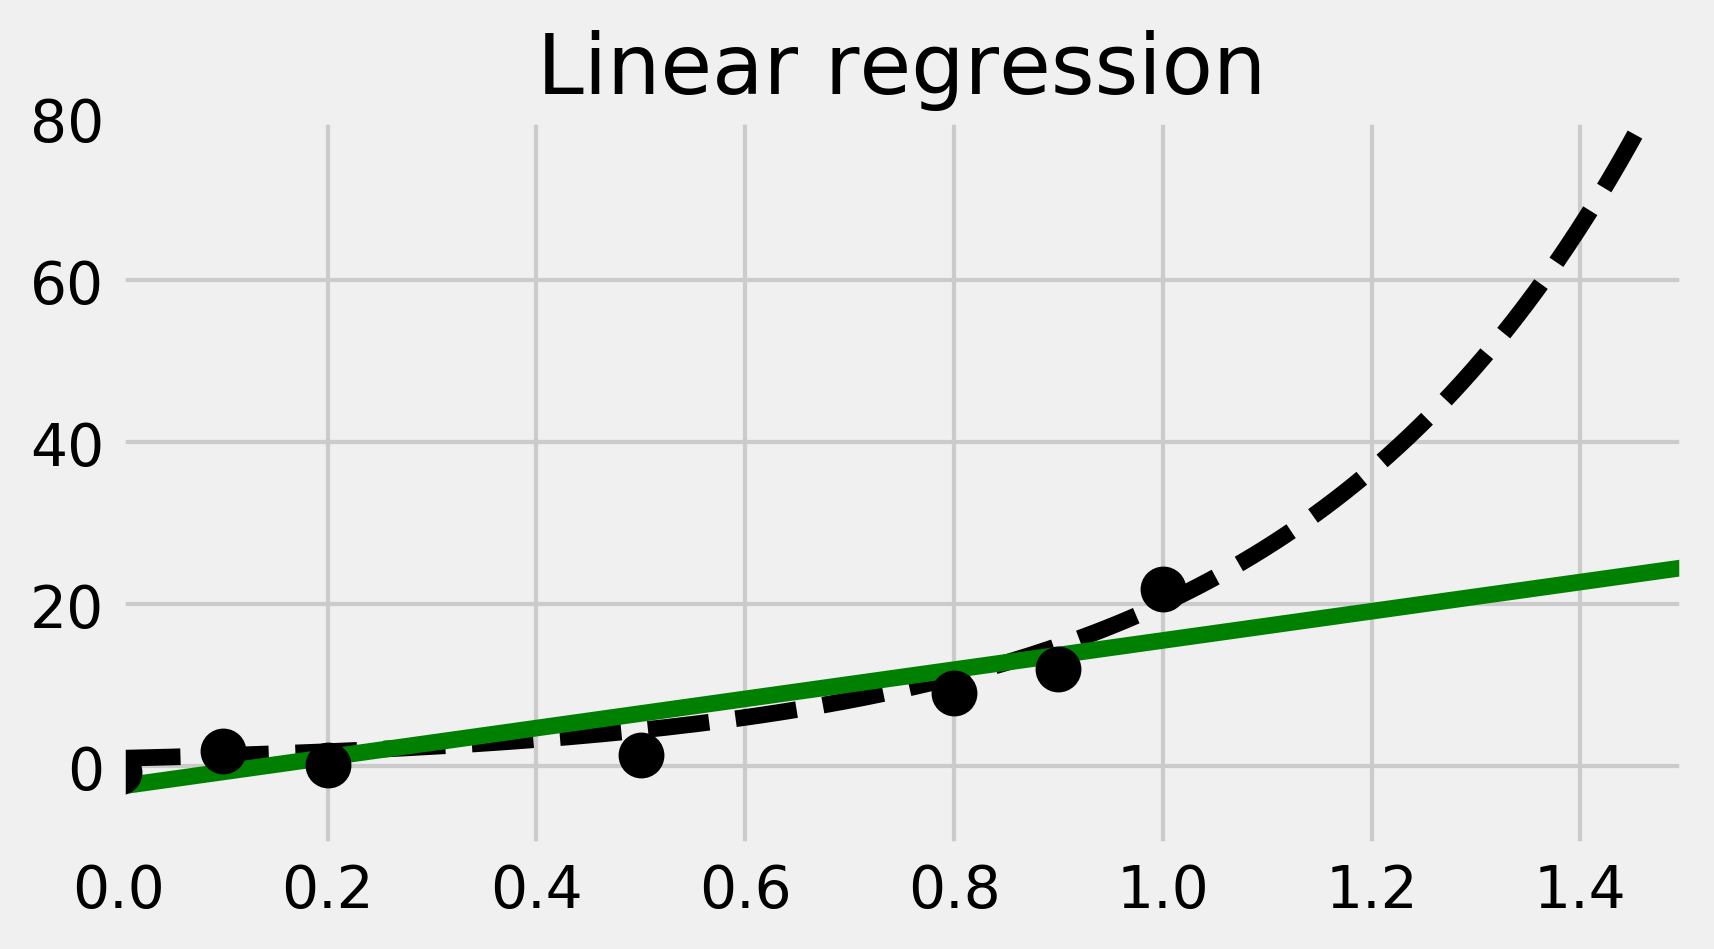
lr = lm.LinearRegression()
# We train the model on our training dataset.
lr.fit(x[:, np.newaxis], y)
# Now, we predict points with our trained model.
y_lr = lr.predict(x_tr[:, np.newaxis])
fig, ax = plt.subplots(1, 1, figsize=(6, 3))
ax.plot(x_tr, y_tr, '--k')
ax.plot(x_tr, y_lr, 'g')
ax.plot(x, y, 'ok', ms=10)
ax.set_xlim(0, 1.5)
ax.set_ylim(-10, 80)
ax.set_title("Linear regression")

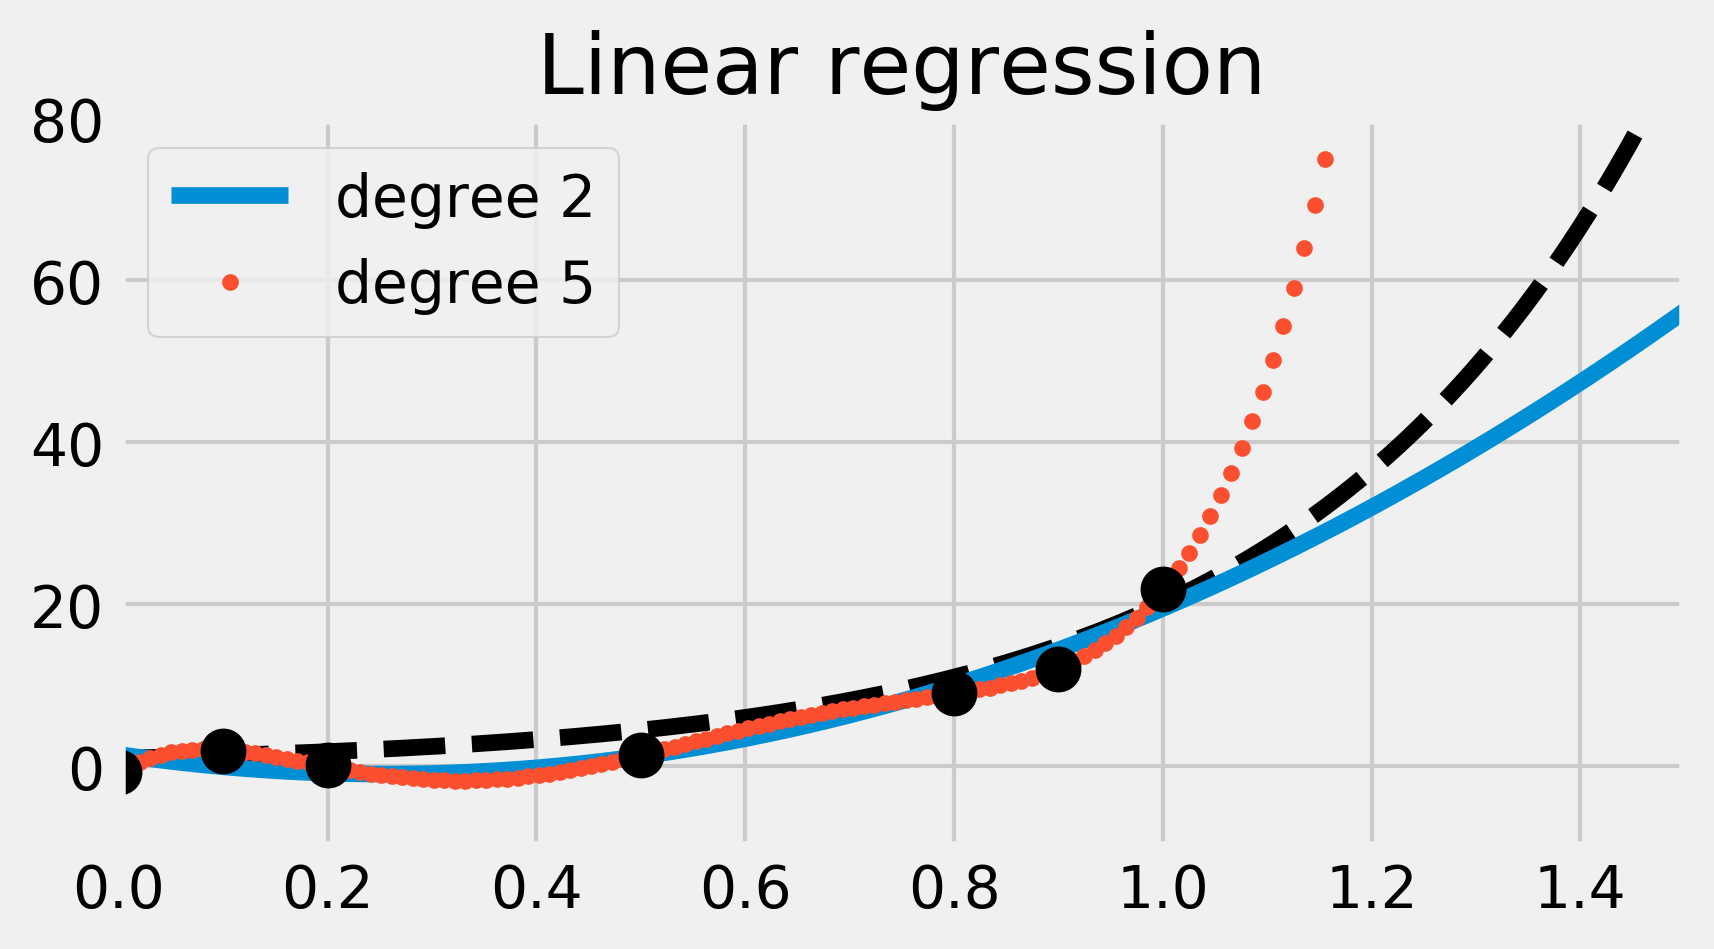
lrp = lm.LinearRegression()
fig, ax = plt.subplots(1, 1, figsize=(6, 3))
ax.plot(x_tr, y_tr, '--k')

for deg, s in zip([2, 5], ['-', '.']):
    lrp.fit(np.vander(x, deg + 1), y)
    y_lrp = lrp.predict(np.vander(x_tr, deg + 1))
    ax.plot(x_tr, y_lrp, s,
            label=f'degree {deg}')
    ax.legend(loc=2)
    ax.set_xlim(0, 1.5)
    ax.set_ylim(-10, 80)
    # Print the model's coefficients.
    print(f'Coefficients, degree {deg}:\n\t',
          ' '.join(f'{c:.2f}' for c in lrp.coef_))
ax.plot(x, y, 'ok', ms=10)
ax.set_title("Linear regression")
Coefficients, degree 2:
    36.95 -18.92 0.00
Coefficients, degree 5:
    903.98 -2245.99 1972.43 -686.45 78.64 0.00

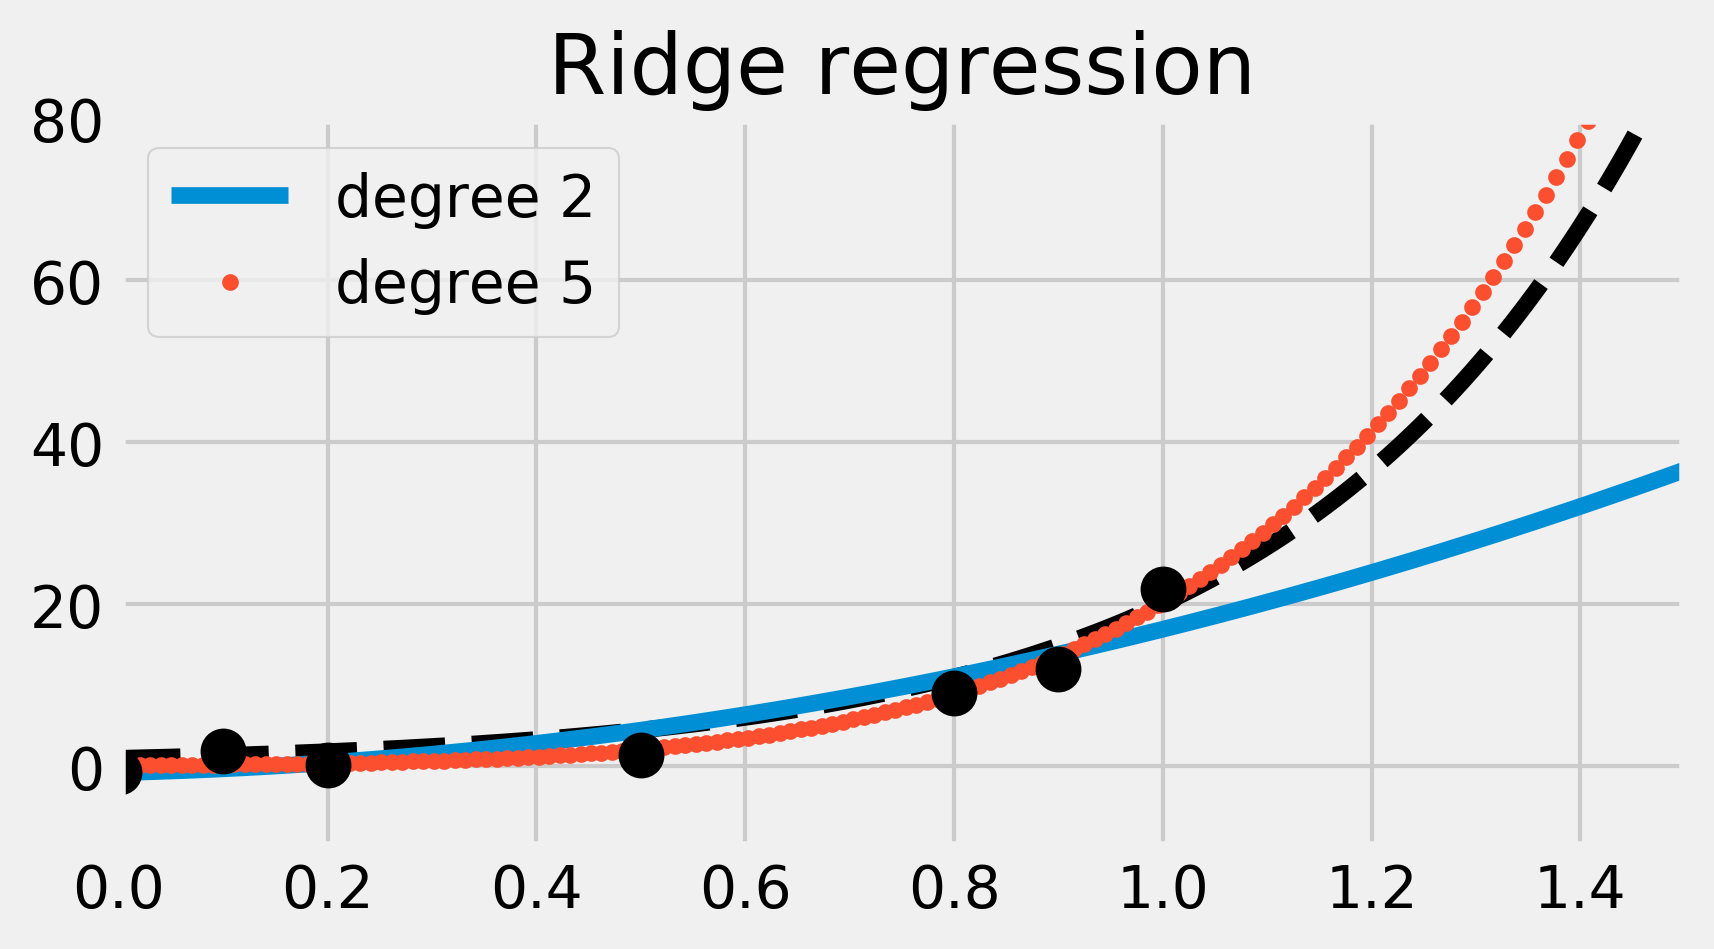
ridge = lm.RidgeCV()

fig, ax = plt.subplots(1, 1, figsize=(6, 3))
ax.plot(x_tr, y_tr, '--k')

for deg, s in zip([2, 5], ['-', '.']):
    ridge.fit(np.vander(x, deg + 1), y)
    y_ridge = ridge.predict(np.vander(x_tr, deg + 1))
    ax.plot(x_tr, y_ridge, s,
            label='degree ' + str(deg))
    ax.legend(loc=2)
    ax.set_xlim(0, 1.5)
    ax.set_ylim(-10, 80)
    # Print the model's coefficients.
    print(f'Coefficients, degree {deg}:',
          ' '.join(f'{c:.2f}' for c in ridge.coef_))

ax.plot(x, y, 'ok', ms=10)
ax.set_title("Ridge regression")
Coefficients, degree 2: 14.43 3.27 0.00
Coefficients, degree 5: 7.07 5.88 4.37 2.37 0.40 0.00
