Jupyter Snippet CB2nd 01_pandas
Jupyter Snippet CB2nd 01_pandas
7.1. Exploring a dataset with pandas and matplotlib
from datetime import datetime
import numpy as np
import pandas as pd
import matplotlib.pyplot as plt
%matplotlib inline
player = 'Roger Federer'
df = pd.read_csv('https://github.com/ipython-books/'
                 'cookbook-2nd-data/blob/master/'
                 'federer.csv?raw=true',
                 parse_dates=['start date'],
                 dayfirst=True)
df.head(3)

df['win'] = df['winner'] == player
df['win'].tail()
1174    False
1175     True
1176     True
1177     True
1178    False
Name: win, dtype: bool
won = 100 * df['win'].mean()
print(f"{player} has won {won:.0f}% of his matches.")
Roger Federer has won 82% of his matches.
date = df['start date']
df['dblfaults'] = (df['player1 double faults'] /
                   df['player1 total points total'])
df['dblfaults'].tail()
1174    0.018116
1175    0.000000
1176    0.000000
1177    0.011561
1178         NaN
Name: dblfaults, dtype: float64
df['dblfaults'].describe()
count    1027.000000
mean        0.012129
std         0.010797
min         0.000000
25%         0.004444
50%         0.010000
75%         0.018108
max         0.060606
Name: dblfaults, dtype: float64
df.groupby('surface')['win'].mean()
surface
Indoor: Carpet    0.736842
Indoor: Clay      0.833333
Indoor: Hard      0.836283
Outdoor: Clay     0.779116
Outdoor: Grass    0.871429
Outdoor: Hard     0.842324
Name: win, dtype: float64
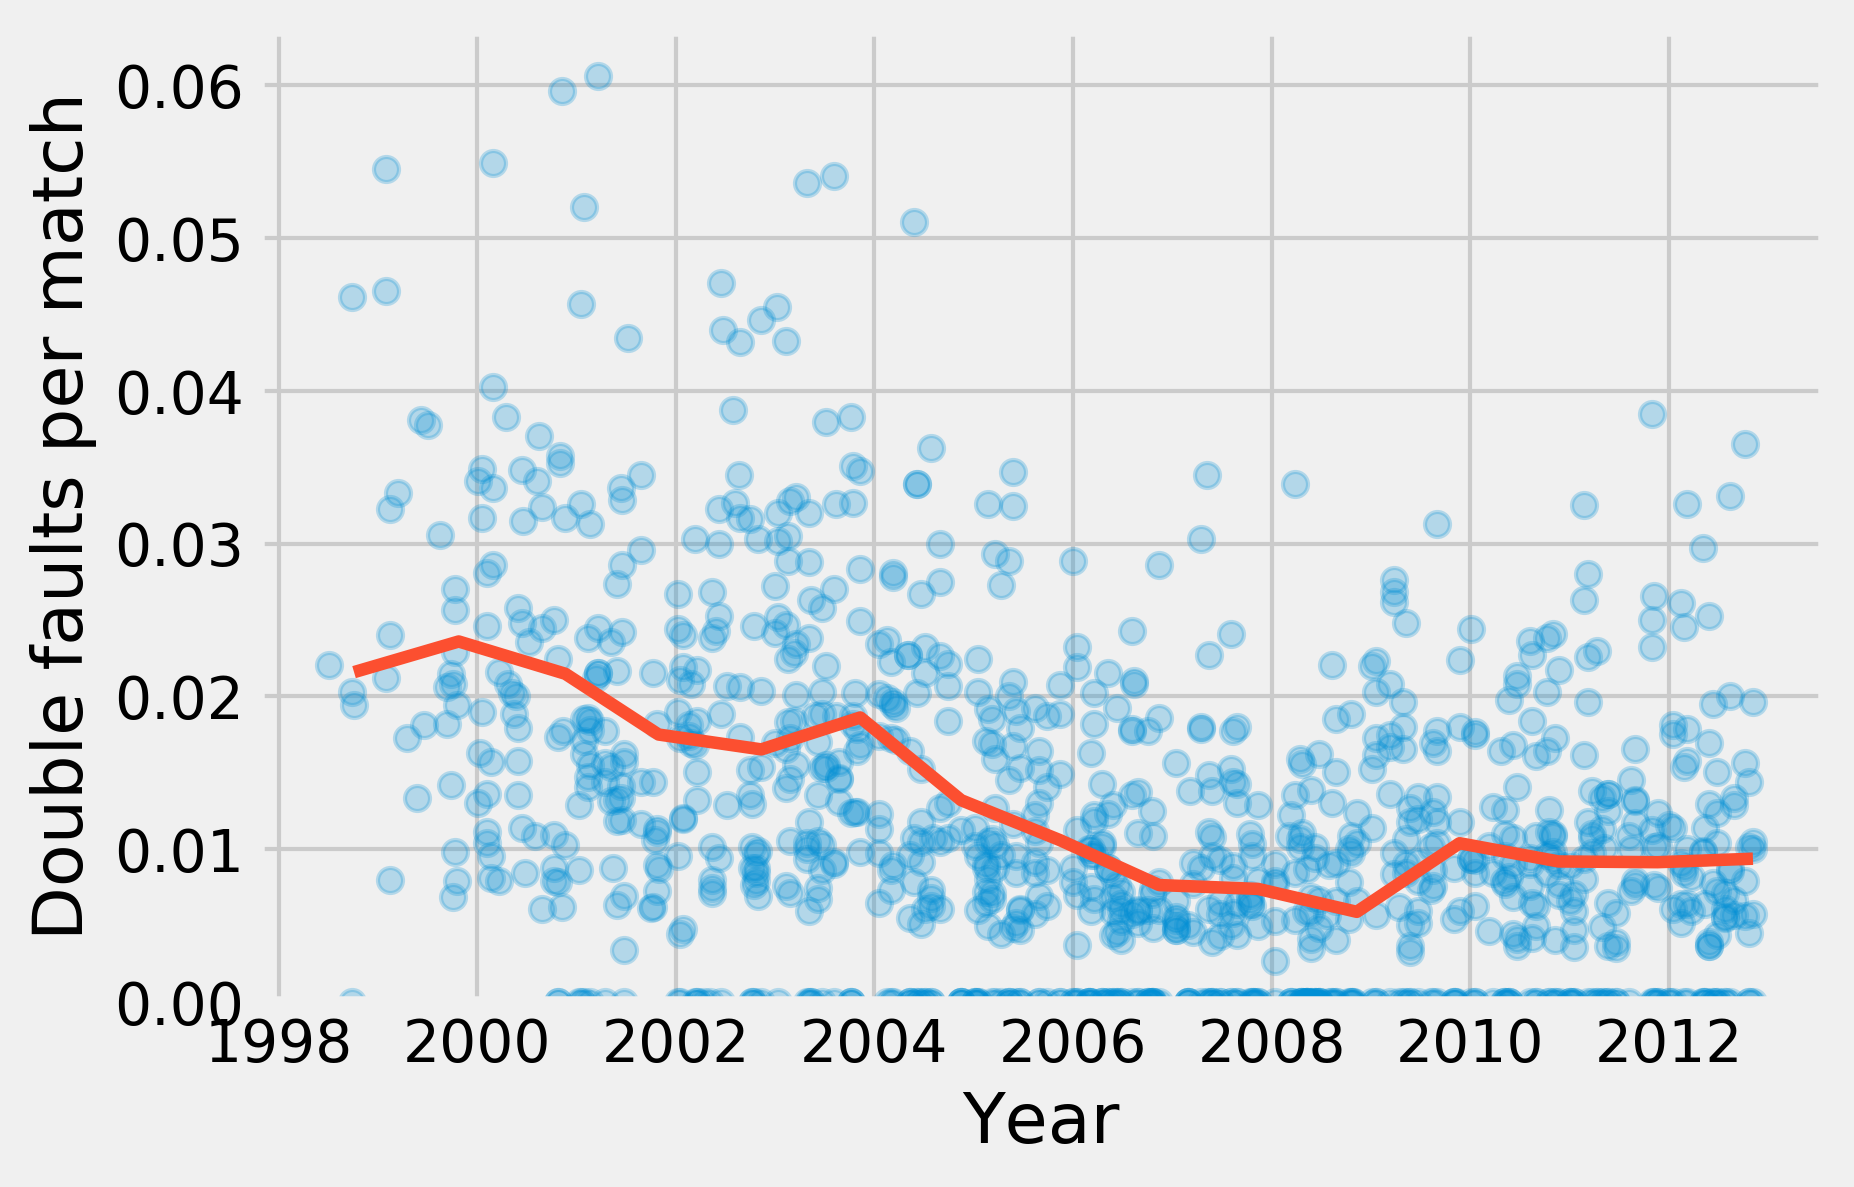
gb = df.groupby('year')
fig, ax = plt.subplots(1, 1)
ax.plot_date(date.astype(datetime), df['dblfaults'],
             alpha=.25, lw=0)
ax.plot_date(gb['start date'].max().astype(datetime),
             gb['dblfaults'].mean(), '-', lw=3)
ax.set_xlabel('Year')
ax.set_ylabel('Double faults per match')
ax.set_ylim(0)
